. 2011 Feb;272(1-2):125-34.
doi: 10.1016/j.heares.2010.10.009. Epub 2010 Nov 20.

A possible role for a paralemniscal auditory pathway in the coding of slow temporal information

Affiliations

A possible role for a paralemniscal auditory pathway in the coding of slow temporal information

Daniel A Abrams et al. Hear Res. 2011 Feb.

Abstract

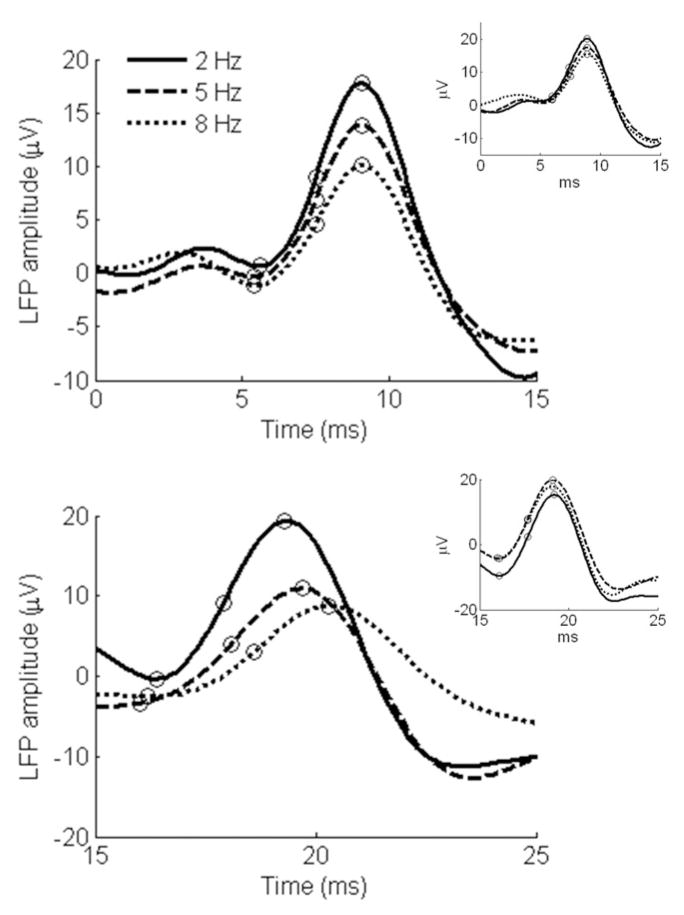
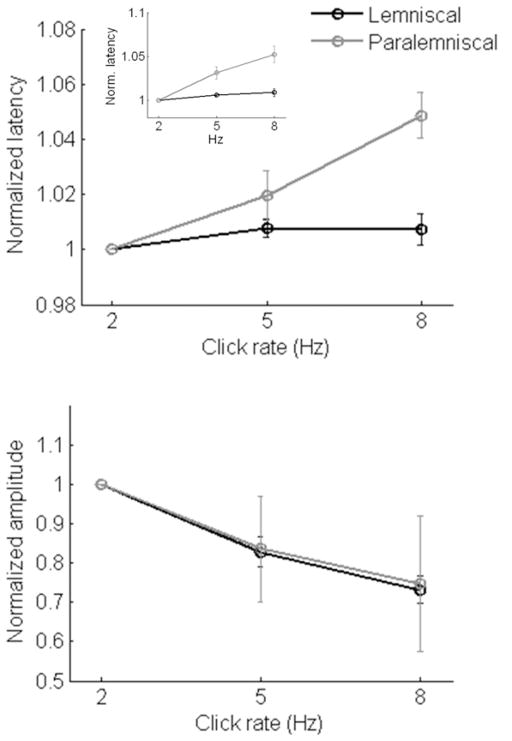
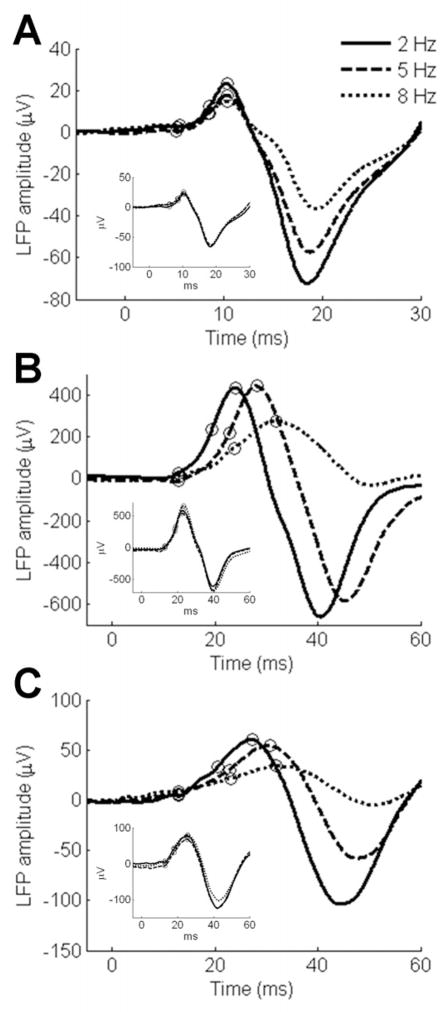
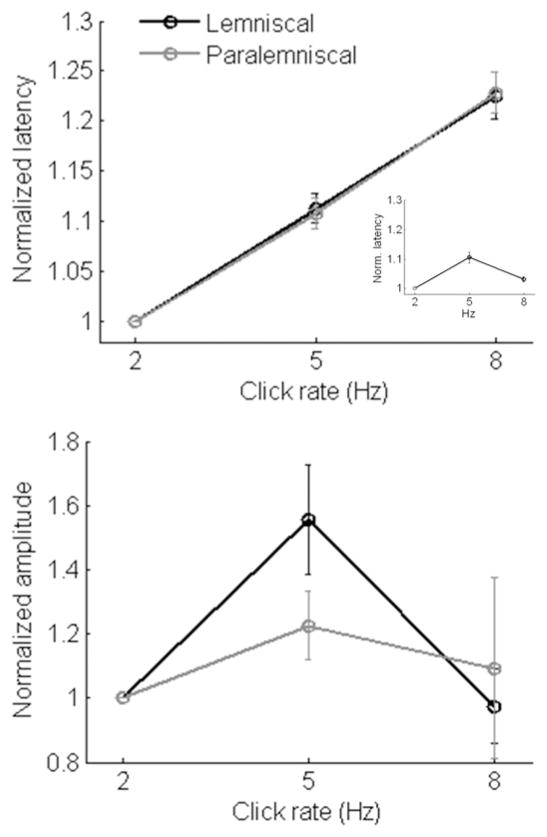
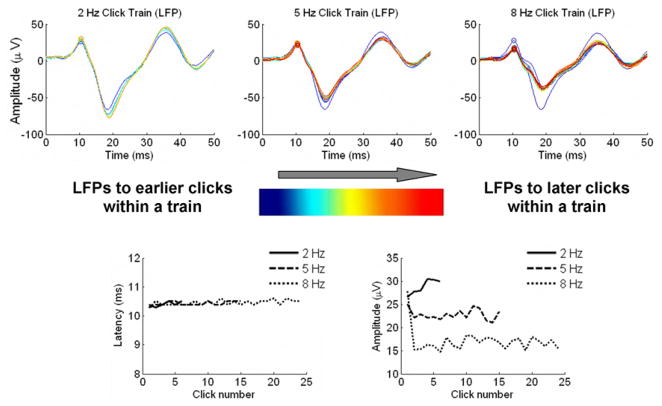
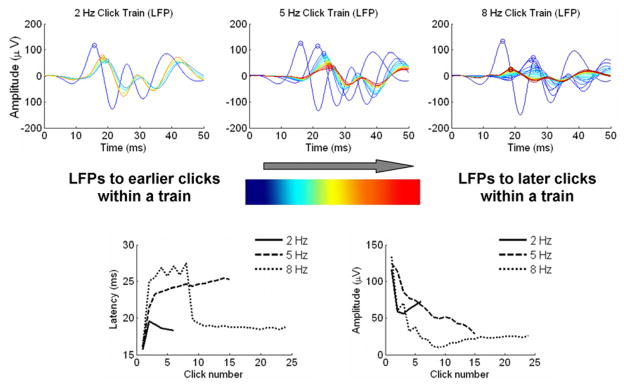
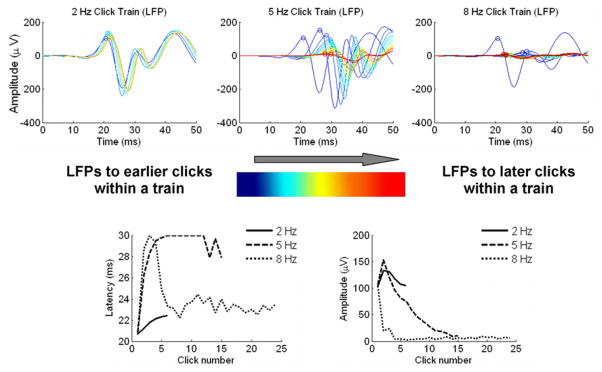
Low-frequency temporal information present in speech is critical for normal perception, however the neural mechanism underlying the differentiation of slow rates in acoustic signals is not known. Data from the rat trigeminal system suggest that the paralemniscal pathway may be specifically tuned to code low-frequency temporal information. We tested whether this phenomenon occurs in the auditory system by measuring the representation of temporal rate in lemniscal and paralemniscal auditory thalamus and cortex in guinea pig. Similar to the trigeminal system, responses measured in auditory thalamus indicate that slow rates are differentially represented in a paralemniscal pathway. In cortex, both lemniscal and paralemniscal neurons indicated sensitivity to slow rates. We speculate that a paralemniscal pathway in the auditory system may be specifically tuned to code low-frequency temporal information present in acoustic signals. These data suggest that somatosensory and auditory modalities have parallel sub-cortical pathways that separately process slow rates and the spatial representation of the sensory periphery.


Figures

Figure 1
Figure 1. Thalamic LFPs to click trains
(a) Representative lemniscal (MGv) and (b) paralemniscal thalamic (MGs) responses. Plots represent the average local field potential (LFP) in response to clicks 2 and 3 in a train. Figure 1 insets: plots represent LFPs in response to the first click in a train measured in MGv (Figure 1a inset) and MGs (Figure 1b inset). The circles on the plots indicate the peak, base and half-peak measures recorded for each LFP at each click rate.
Figure 2
Figure 2. Mean Thalamic LFPs
Mean (± SE) local field potential (a) latency and (b) amplitude for lemniscal and paralemniscal thalamic responses. Figure 2a inset: mean “steady-state” thalamic LFP latencies.
Figure 3
Figure 3. Cortical LFPs to click trains
(a–b) Two representative lemniscal cortical responses (A1 and DC) and (c) a representative paralemniscal (VCB) cortical response. Plots represent the average local field potential in response to clicks 2 and 3 in a train. Figure 3 insets: plots represent LFPs in response to the first click in a train measured in lemniscal cortex (Figure 3a, 4b insets) and VCB (Figure 3c inset). The circles on the plots indicate the peak, base and half-peak measures recorded for each LFP at each click rate.
Figure 4
Figure 4. Mean Cortical LFPs
Mean (± SE) local field potential (a) latency and (b) amplitude for lemniscal and paralemniscal cortical responses. Figure 4a inset: mean “steady-state” cortical LFP latencies.
Figure 5
Figure 5. Lemniscal cortical dynamics, pattern #1
Top: overlays of LFPs from a lemniscal recording site in response to each click in a click train for the 2 Hz condition (left), 5 Hz condition (center) and 8 Hz condition (right). LFPs in response to earlier clicks in the train are plotted in blue while responses to the last clicks in the train are plotted in red. Bottom left: peak LFP latency as a function of click number for the three rate conditions. Bottom right: peak LFP amplitude as a function of click number for the three rate conditions.
Figure 6
Figure 6. Lemniscal cortical dynamics, pattern #2
Top: overlays of LFPs from a lemniscal recording site in response to each click in a click train for the 2 Hz condition (left), 5 Hz condition (center) and 8 Hz condition (right). LFPs in response to earlier clicks in the train are plotted in blue while responses to the last clicks in the train are plotted in red. Bottom left: peak LFP latency as a function of click number for the three rate conditions. Bottom right: peak LFP amplitude as a function of click number for the three rate conditions.
Figure 7
Figure 7. Paralemniscal cortical dynamics
Top: overlays of LFPs from a paralemniscal recording site in response to each click in a click train for the 2 Hz condition (left), 5 Hz condition (center) and 8 Hz condition (right). LFPs in response to earlier clicks in the train are plotted in blue while responses to the last clicks in the train are plotted in red. Bottom left: peak LFP latency as a function of click number for the three rate conditions. Bottom right: peak LFP amplitude as a function of click number for the three rate conditions.

Similar articles

Cited by

References

    1. Ahissar E, Zacksenhouse M. Temporal and spatial coding in the rat vibrissal system. Prog Brain Res. 2001;130:75–87. - PubMed
    1. Ahissar E, Haidarliu S, Zacksenhouse M. Decoding temporally encoded sensory input by cortical oscillations and thalamic phase comparators. Proc Natl Acad Sci U S A. 1997;94:11633–8. - PMC - PubMed
    1. Ahissar E, Sosnik R, Haidarliu S. Transformation from temporal to rate coding in a somatosensory thalamocortical pathway. Nature. 2000;406:302–6. - PubMed
    1. Anderson LA, Christianson GB, Linden JF. Stimulus-specific adaptation occurs in the auditory thalamus. J Neurosci. 2009;29:7359–63. - PMC - PubMed
    1. Anderson SE, Kilgard MP, Sloan AM, Rennaker RL. Response to broadband repetitive stimuli in auditory cortex of the unanesthetized rat. Hear Res. 2006;213:107–17. - PubMed

Publication types