. 2010 Nov 24;40(4):582-93.
doi: 10.1016/j.molcel.2010.11.005.

Splicing-dependent RNA polymerase pausing in yeast

Affiliations

Splicing-dependent RNA polymerase pausing in yeast

Ross D Alexander et al. Mol Cell. .

Abstract

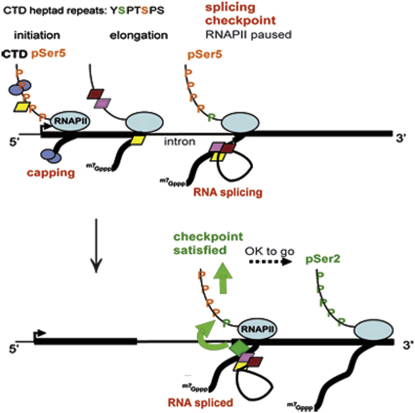
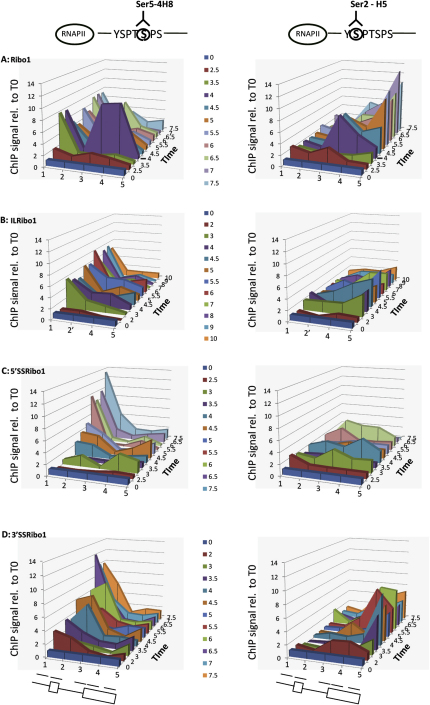
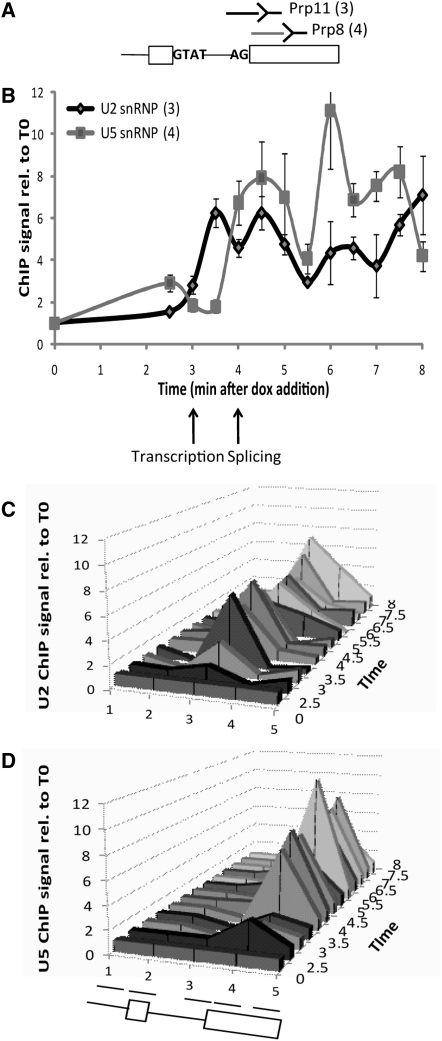
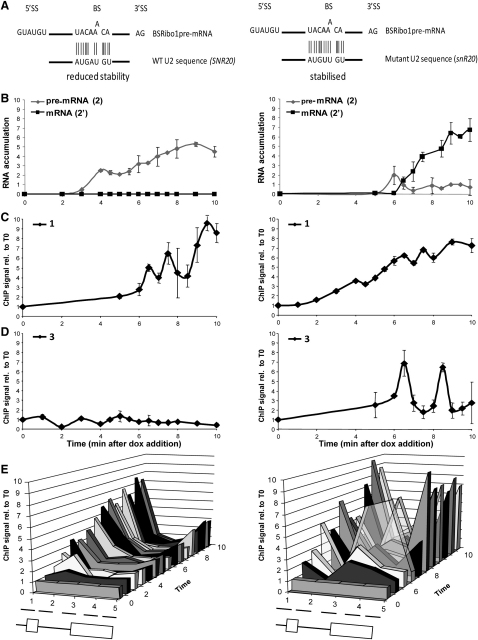
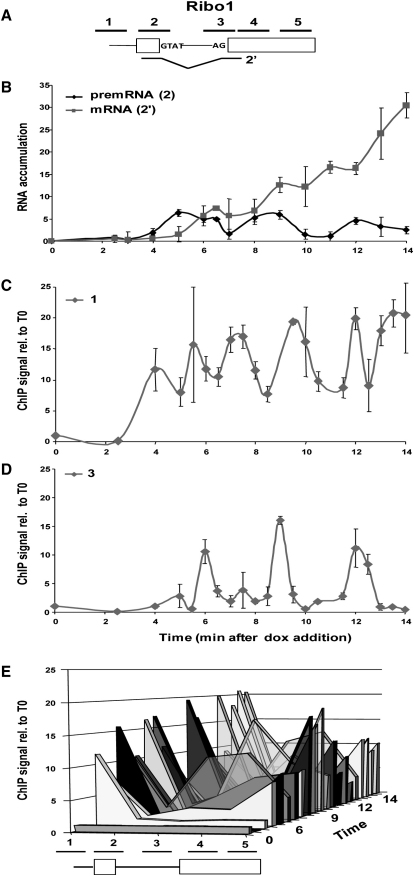
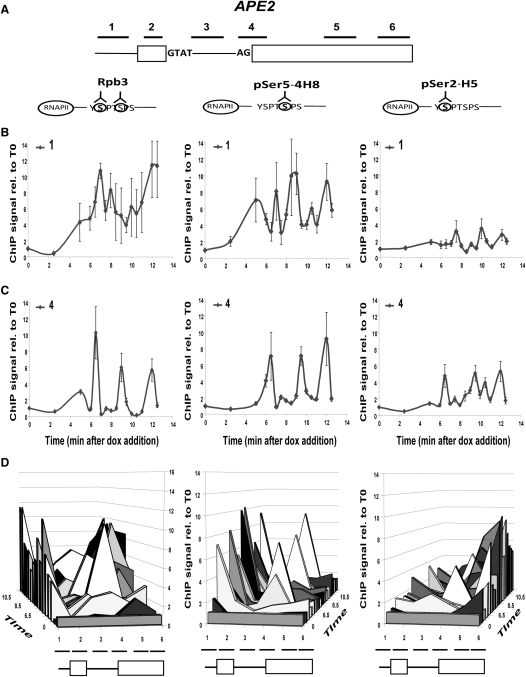
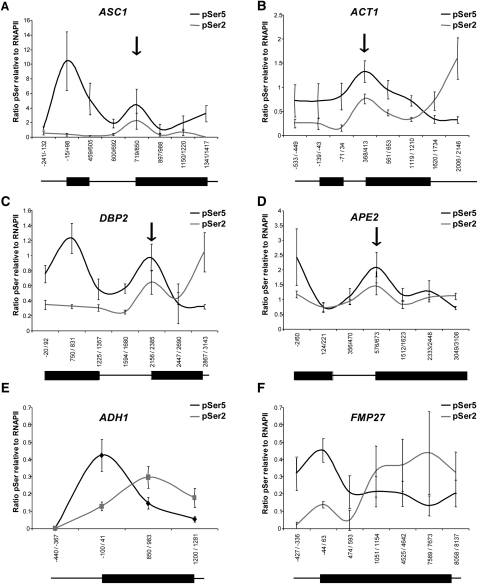
In eukaryotic cells, there is evidence for functional coupling between transcription and processing of pre-mRNAs. To better understand this coupling, we performed a high-resolution kinetic analysis of transcription and splicing in budding yeast. This revealed that shortly after induction of transcription, RNA polymerase accumulates transiently around the 3' end of the intron on two reporter genes. This apparent transcriptional pause coincides with splicing factor recruitment and with the first detection of spliced mRNA and is repeated periodically thereafter. Pausing requires productive splicing, as it is lost upon mutation of the intron and restored by suppressing the splicing defect. The carboxy-terminal domain of the paused polymerase large subunit is hyperphosphorylated on serine 5, and phosphorylation of serine 2 is first detected here. Phosphorylated polymerase also accumulates around the 3' splice sites of constitutively expressed, endogenous yeast genes. We propose that transcriptional pausing is imposed by a checkpoint associated with cotranscriptional splicing.


Figures

None
Graphical abstract
Figure 1
Figure 1
Analysis of Ribo Reporter Induction (A) Diagram of Ribo1, ILRibo1, 5′SSRibo1, and 3′SSRibo1 genes. Exons are represented by rectangles, and the intron by a line with sequences at the ends. The reporter genes are based on previously described ACT1-PGK1 constructs (Hilleren and Parker, 2003; Alexander et al., 2010) expressed under control of a tetO7-CYC1-UAS promoter (Bellí et al., 1998). The lines above indicate amplicons analyzed in RT-qPCR or ChIP analyses: 1, 2, 3, 4, and 5 correspond to the promoter, exon 1/5′SS, 3′SS, 5′ end of exon 2 and 3′ end of exon 2, respectively. Amplicon 2′ corresponds to spliced Ribo1 mRNA or the 5′ end of the intronless ILRibo1. Lariat introns (6) were assayed with an oligo that hybridizes across the 2′-5′phosphodiester bond at the branch site (Vogel et al., 1997). See the Supplemental Information for full details of strains, reporter genes, and primer sequences. (B) RT-qPCR analysis of accumulation of pre-mRNA, mRNA, or lariat RNA species (amplicon indicated in parentheses) showing the increase compared to time of doxycyclin addition (T0). Error bars indicate standard error for RT performed in triplicate and qPCR also performed in triplicate. (C) ChIP analysis (presented as percentage of input relative to uninduced level at T0) to detect RNAPII at the promoter (amplicon 1) using anti-Rpb3 antibodies (Neoclone) with the same cultures as above. (D) ChIP analysis to detect RNAPII at the 5′ end of exon 2 (amplicon 4), otherwise as above. (E) 3D representation of the RNAPII ChIP data, showing RNAPII occupancy at all positions tested (x axis) at times indicated on the z axis. In ChIP assays, error bars indicate standard error for qPCR performed in triplicate. The kinetic resolution of the ChIP assay was tested by RT-qPCR measurement of Ribo1 transcription during the formaldehyde treatment, showing that transcript accumulation ceases immediately, and indicating that RNAPII activity is halted very rapidly (data not shown). See also Figure S1.
Figure 2
Figure 2
Phosphorylation Status of RNAPII CTD during Induction Top: Diagrams showing RNAPII CTD heptad repeat with antibodies to detect pSer5 (4H8; Millipore) or pSer2 (H5; Covance). (A–D) ChIP analysis to detect RNAPII with pSer5 (left) or pSer2 (right) at different times after dox addition (z axis), at all positions tested (x axis) for Ribo1, ILRibo1, 5′SSRibo1, and 3′SSRibo1 as indicated. Data are plotted in 3D and presented as percentage input relative to T0. Other details are as in Figure 1. See also Figure S2.
Figure 3
Figure 3
Cotranscriptional Recruitment of Splicing Factors (A and B) The positions on Ribo1 (A) at which recruitment of Prp11p (U2 snRNP; black) or Prp8p (U5 snRNP; gray) was detected by ChIP as shown in (B), using the same culture as in Figure 1B. Error bars indicate standard error for qPCR performed in triplicate. Arrows below indicate the times at which pre-mRNA and spliced mRNA were first detected. (C and D) 3D representations of the ChIP data for Prp11p and Prp8p respectively at different positions on the Ribo1 gene (x axis) and at different times after dox addition (z axis).
Figure 4
Figure 4
It Is the Splicing Event Rather than the Intron Sequence that Causes RNAPII to Pause at the 3′SS (A) Diagram showing BSRibo1 mutant branchsite sequence base paired to WT U2 snRNA (left) and to mutant U2 snRNA (right). (B) RT-qPCR analysis of BSRibo1 pre-mRNA and spliced mRNA accumulation in the presence of WT (left) and mutant (right) U2. (C–E) ChIP analysis to detect RNAPII on the BSRibo1 gene using anti-Rpb3p antibodies. Details are as in Figures 1C–1E. Error bars indicate standard error for qPCR performed in triplicate. See also Figure S3 for more detail and for ChIP analysis of pSer5 and pSer2.
Figure 5
Figure 5
RNAPII Pauses Repeatedly at the 3′ End of the Ribo1 Intron Transcription, splicing, and RNAPII recruitment were analyzed after Ribo1 induction as described in Figure 1 but for a longer period of time. Error bars indicate standard error for qPCR performed in triplicate. For more detail, see also Figure S4.
Figure 6
Figure 6
RNAPII Pauses Repeatedly at the 3′ End of the APE2 Intron ChIP was performed to measure RNAPII recruitment to the APE2 gene after doxycyclin induction as described in Figure 1, amplifying the six regions indicated in (A). Results are shown for ChIP of RNAPII at the promoter (amplicon 1), 3′SS (amplicon 4), or at all positions tested (B–D, respectively), using antibodies to total RNAPII (anti-Rpb3p; left), pSer5 (4H8 antibodies; middle) or pSer2 (H5 antibodies; right). Error bars indicate the standard error for qPCR performed in triplicate. For more detail, see also Figure S5.
Figure 7
Figure 7
Phosphorylated RNAPII Accumulates around the 3′ Splice Sites of Endogenous Yeast Intron-Containing Genes ChIP analysis was performed to detect RNAPII with pSer5 (4H8 antibodies, black) or pSer2 (H5 antibodies, gray) along the lengths of the intron-containing genes ASC1, ACT1, DBP2, and APE2 and the intronless genes ADH1 and FMP27, all of which are constitutively expressed in yeast cells grown under steady-state conditions. Results are presented as the percentage of input relative to total RNAPII. Error bars indicate standard error for qPCR performed for three different cultures, each assayed in triplicate. Numbers indicate the positions of primers used for qPCR relative to the start codon of each open reading frame. Vertical arrows indicate the positions of the 3′SS, and in the line drawings, the thick lines indicate the positions of exons with respect to the PCR amplicons. For total RNAPII (anti-Rpb3p) ChIP data, see also Figure S6.

Comment in

  • A pause to splice.
    Andersen PK, Jensen TH. Andersen PK, et al. Mol Cell. 2010 Nov 24;40(4):503-5. doi: 10.1016/j.molcel.2010.11.019. Mol Cell. 2010. PMID: 21095579

References

    1. Albers M., Diment A., Muraru M., Russell C.S., Beggs J.D. Identification and characterization of Prp45p and Prp46p, essential pre-mRNA splicing factors. RNA. 2003;9:138–150. - PMC - PubMed
    1. Alexander R.D., Barrass J.D., Dichtl B., Kos M., Obtulowicz T., Robert M.C., Koper M., Karkusiewicz I., Mariconti L., Tollervey D. RiboSys, a high-resolution, quantitative approach to measure the in vivo kinetics of pre-mRNA splicing and 3′-end processing in Saccharomyces cerevisiae. RNA. 2010 in press. Published online October 25, 2010. - PMC - PubMed
    1. Batsché E., Yaniv M., Muchardt C. The human SWI/SNF subunit Brm is a regulator of alternative splicing. Nat. Struct. Mol. Biol. 2006;13:22–29. - PubMed
    1. Bellí G., Garí E., Piedrafita L., Aldea M., Herrero E. An activator/repressor dual system allows tight tetracycline-regulated gene expression in budding yeast. Nucleic Acids Res. 1998;26:942–947. - PMC - PubMed
    1. Beyer A.L., Osheim Y.N. Splice site selection, rate of splicing, and alternative splicing on nascent transcripts. Genes Dev. 1988;2:754–765. - PubMed

Publication types

MeSH terms