Single-Molecule characterization of oligomerization kinetics and equilibria of the tumor suppressor p53
- PMID: 21097469
- PMCID: PMC3064802
- DOI: 10.1093/nar/gkq800
Single-Molecule characterization of oligomerization kinetics and equilibria of the tumor suppressor p53
Abstract
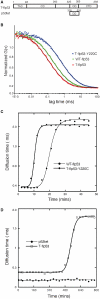
The state of oligomerization of the tumor suppressor p53 is an important factor in its various biological functions. It has a well-defined tetramerization domain, and the protein exists as monomers, dimers and tetramers in equilibrium. The dissociation constants between oligomeric forms are so low that they are at the limits of measurement by conventional methods in vitro. Here, we have used the high sensitivity of single-molecule methods to measure the equilibria and kinetics of oligomerization of full-length p53 and its isolated tetramerization domain, p53tet, at physiological temperature, pH and ionic strength using fluorescence correlation spectroscopy (FCS) in vitro. The dissociation constant at 37 °C for tetramers dissociating into dimers for full-length p53 was 50 ± 7 nM, and the corresponding value for dimers into monomers was 0.55 ± 0.08 nM. The half-lives for the two processes were 20 and 50 min, respectively. The equivalent quantities for p53tet were 150 ± 10 nM, 1.0 ± 0.14 nM, 2.5 ± 0.4 min and 13 ± 2 min. The data suggest that unligated p53 in unstressed cells should be predominantly dimeric. Single-molecule FCS is a useful procedure for measuring dissociation equilibria, kinetics and aggregation at extreme sensitivity.
Figures


References
-
- Vousden KH, Prives C. Blinded by the light: the growing complexity of p53. Cell. 2009;137:413–431. - PubMed
-
- Petitjean A, Mathe E, Kato S, Ishioka C, Tavtigian SV, Hainaut P, Olivier M. Impact of mutant p53 functional properties on TP53 mutation patterns and tumor phenotype: lessons from recent developments in the IARC TP53 database. Hum. Mutat. 2007;28:622–629. - PubMed
-
- Nicholls CD, McLure KG, Shields MA, Lee PW. Biogenesis of p53 involves cotranslational dimerization of monomers and posttranslational dimerization of dimers. Implications on the dominant negative effect. J. Biol. Chem. 2002;277:12937–12945. - PubMed
-
- Varley JM, McGown G, Thorncroft M, Cochrane S, Morrison P, Woll P, Kelsey AM, Mitchell EL, Boyle J, Birch JM, et al. A previously undescribed mutation within the tetramerisation domain of TP53 in a family with Li-Fraumeni syndrome. Oncogene. 1996;12:2437–2442. - PubMed
Publication types
MeSH terms
Substances
Grants and funding
LinkOut - more resources
Full Text Sources
Research Materials
Miscellaneous

