. 2011 Feb 18;286(7):5392-403.
doi: 10.1074/jbc.M110.161851. Epub 2010 Nov 19.

Negative regulation of the endocytic adaptor disabled-2 (Dab2) in mitosis

Affiliations

Negative regulation of the endocytic adaptor disabled-2 (Dab2) in mitosis

David Chetrit et al. J Biol Chem. .

Abstract

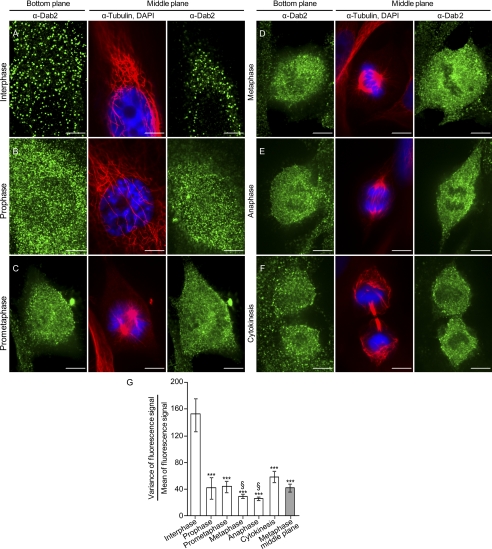
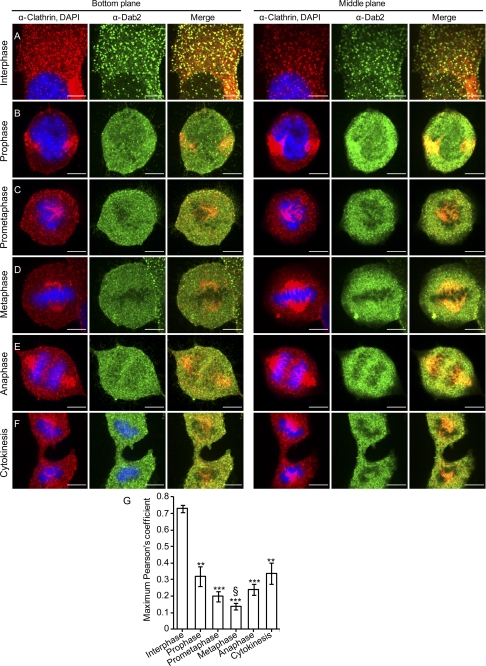
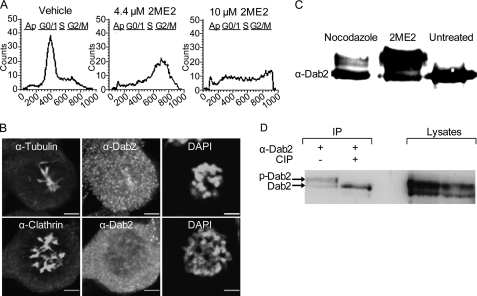
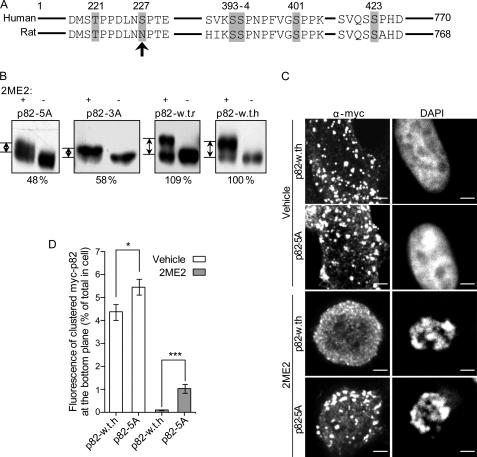
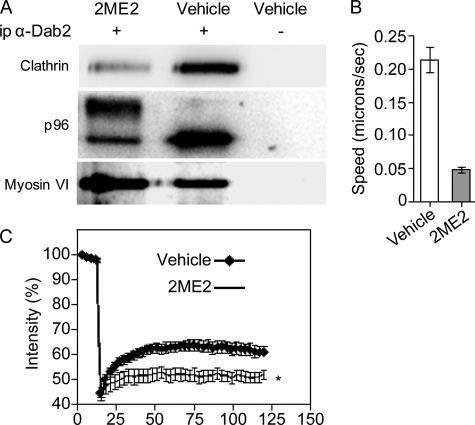
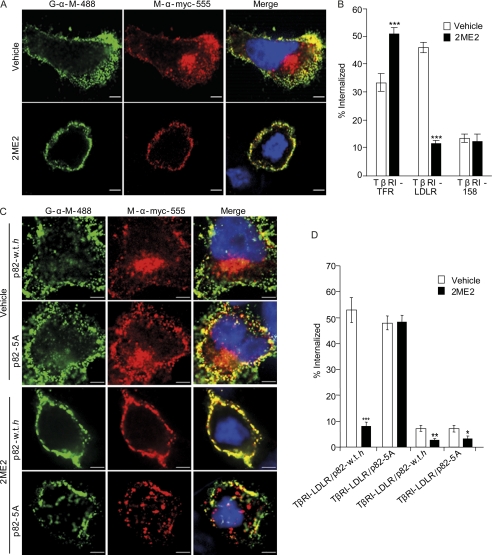
Mitotic cells undergo extensive changes in shape and size through the altered regulation and function of their membrane trafficking machinery. Disabled 2 (Dab2), a multidomain cargo-specific endocytic adaptor and a mediator of signal transduction, is a potential integrator of trafficking and signaling. Dab2 binds effectors of signaling and trafficking that localize to different intracellular compartments. Thus, differential localization is a putative regulatory mechanism of Dab2 function. Furthermore, Dab2 is phosphorylated in mitosis and is thus regulated in the cell cycle. However, a detailed description of the intracellular localization of Dab2 in the different phases of mitosis and an understanding of the functional consequences of its phosphorylation are lacking. Here, we show that Dab2 is progressively displaced from the membrane in mitosis. This phenomenon is paralleled by a loss of co-localization with clathrin. Both phenomena culminate in metaphase/anaphase and undergo partial recovery in cytokinesis. Treatment with 2-methoxyestradiol, which arrests cells at the spindle assembly checkpoint, induces the same effects observed in metaphase cells. Moreover, 2-methoxyestradiol also induced Dab2 phosphorylation and reduced Dab2/clathrin interactions, endocytic vesicle motility, clathrin exchange dynamics, and the internalization of a receptor endowed with an NPXY endocytic signal. Serine/threonine to alanine mutations, of residues localized to the central region of Dab2, attenuated its phosphorylation, reduced its membrane displacement, and maintained its endocytic abilities in mitosis. We propose that the negative regulation of Dab2 is part of an accommodation of the cell to the altered physicochemical conditions prevalent in mitosis, aimed at allowing endocytic activity throughout the cell cycle.


Figures

FIGURE 1.
FIGURE 1.
Intracellular staining pattern of Dab2 is altered in mitosis. A–F, unsynchronized ES-2 cells were plated onto glass coverslips. 16 h post-plating, cells were fixed and stained against microtubules, Dab2, and DNA. Cells were imaged by confocal microscopy and assigned different stages of the cell cycle according to the distribution pattern of DNA and microtubules. Bar, 10 μm. G, graph depicts the quantification of the ratio of the variance-of-fluorescence-signal to the mean of fluorescence-signal (VtM) of Dab2 in the bottom plane of cells imaged as in A–F. Values were calculated with SlidebookTM. Each bar represents the average of 10–17 cells imaged in each condition. Significance was calculated by the Student's t test. ***, p < 0.001, when comparing the average VtM values obtained in all cell cycle stages to the average VtM of interphase cells; §, p < 0.001, when comparing cells in metaphase or anaphase to cells in cytokinesis.
FIGURE 2.
FIGURE 2.
Marked reduction in the co-localization of Dab2 and clathrin in mitotic cells. Unsynchronized ES-2 cells were plated onto glass coverslips. 16 h post-plating, cells were fixed and stained against clathrin, Dab2, and DNA. Cells were imaged by confocal microscopy and assigned different stages of the cell cycle according to the DNA distribution pattern. Bar, 10 μm. G, graph depicts the quantification of the maximal Pearson's CCF of the fluorescence signals of Dab2 and clathrin in the bottom planes of cells imaged as in A–F. Values were calculated with ImageJ software. Each bar represents the average of 10–17 cells imaged in each condition. Significance was calculated by the Student's t test. ***, p < 1E-6; **, p < 0.001, both when comparing the average CCF values obtained in all cell cycle stages to the average CCF obtained in interphase cells; §, p < 0.05, when comparing the average CCF observed in metaphase cells to the average CCF value obtained in cells in cytokinesis or prophase.
FIGURE 3.
FIGURE 3.
2ME2 induces G2/M arrest, the displacement of Dab2 from the membrane, and the phosphorylation of the p96 isoform of Dab2. A, semi-confluent ES-2 cells were treated with 2ME2 (4.4 or 10 μm, 16 h) or the same amount of vehicle, suspended by scraping, and their DNA content was measured by propidium iodide staining and fluorescence-activated cell sorting (FACS). B, ES-2 cells, grown on glass coverslips, were treated with 2ME2 (4.4 μm, 16 h), fixed, permeabilized, and stained as indicated in the panels. C, semi-confluent ES-2 cells were treated with 2ME2 (4.4 μm, 16 h), nocodazole (50 μm, 16 h), or vehicle. Cells were lysed, resolved by SDS-PAGE, and immunoblotted with α-Dab2 antibodies D, semi-confluent ES-2 cells were treated for 16 h with 2ME2, lysed prior to immunoprecipitation with α-Dab2 antibodies. Precipitates were treated or not with calf intestinal phosphatase (CIP). Panel depicts a typical experiment (n = 3; the two lanes to the left are the immunoprecipitation (IP), and the two lanes to the right are 10% of the lysates employed).
FIGURE 4.
FIGURE 4.
Mutation of phosphorylatable sites in Dab2 reduces the 2ME2-induced shift in migration and displacement of Dab2 from the membrane. A, schematic depiction of the central region of the human and rat p96/p82 isoforms of Dab2. Phosphorylatable sites that were mutated in this study are highlighted in gray. Arrow points to position 227, which differs among the human and rat isoforms and was mutated to serine on a rat Myc-p82 background (p82-WT-r) generating p82-WT-h. B, mutation of serines Ser-393, Ser-394, and Ser-401 to alanines reduces the 2ME2-induced shift in migration in SDS-PAGE. Single clones of ES-2 cells stably expressing the different Myc-p82-based constructs were treated or not with 2ME2 (4.4 μm, 16 h). Cell lysates (prepared as in Fig. 3) were separated by SDS-PAGE and immunoblotted with α-Myc antibodies. Panels depict a representative experiment (n = 5). All pairs of treated/untreated cells originate from the same gel and are presented separately due to different brightness/contrast adjustments. The measurement of the distance between the unphosphorylated and the phosphorylated bands of each construct (relative to p82-WT-h) appears below each panel. Similar values were obtained in all repeats of the experiment. C, p82-WT-h and p82-5A cells were plated onto glass coverslips and treated with 2ME2 (4.4 μm, 16 h) or vehicle. Cells were fixed, permeabilized, and stained with DAPI and α-Myc antibodies. Panels depict the bottom confocal plane of representative cells in each condition. D, quantification of the percentage of the Myc-p82 fluorescence signal present as clusters in the bottom plane of the cell. Results are average ± S.E. of three experiments. White columns represent vehicle-treated cells (45 cells per column), and gray columns represent 2ME2-treated cells (96 cells per column); *, p < 0.05; ***, p < 0.00001.
FIGURE 5.
FIGURE 5.
2ME2 treatment reduces Dab2/clathrin interactions, decreases the movement of endocytic vesicles, and inhibits clathrin exchange. A, lysates from ES-2 cells treated with 2ME2 (4.4 μm, 16 h) or vehicle were immunoprecipitated (ip) with rabbit-α-Dab2 antibody or a specificity control. Immunoprecipitates were resolved by SDS-PAGE and immunoblotted with mouse monoclonal α-Dab2, mouse-monoclonal α-clathrin, and rabbit- α-myosin VI. Panel depicts a representative experiment (n = 4). B, ES-2 cells were grown on glass coverslips and treated with 2ME2 (4.4 μm, 16 h) or vehicle. Cells were submitted to live uptake of transferrin (labeled with Alexa-555, 50 μg/ml, 37 °C). After 2 min of continuous uptake, cells were washed with imaging medium, and time lapse series (1 s between acquisitions) of confocal sections of regions adjacent to the cell membrane were acquired (up to 8 min after wash). Bar graph depicts the average ± S.E. of the mean square displacement of 250 vesicles, from 12 different cells per condition, from three independent experiments. C, ES-2 cells were grown on coverslips and transfected with clathrin light chain A fused to GFP (48). 24 h after transfection, cells were treated with 2ME2 (4.4 μm, 16 h) or vehicle. Cells were imaged by confocal microscopy and analyzed by fluorescence recovery after photobleaching (FRAP) (12 cells per condition, three independent experiments), both bleaching and analysis were carried out as in Ref. .
FIGURE 6.
FIGURE 6.
2ME2-mediated cell cycle arrest leads to a specific decrease in the internalization of a receptor with an NPXY endocytic signal. A, ES-2 cells were transfected with the different constructs, based on an epitope-tagged endocytosis-negative truncation mutant of the type I TGF-β receptor (TβRI-158), supplemented or not with either a YXXΦ (TβRI-transferring receptor) or an NPXY-based signal (TβRI-LDLR; all constructs are described in Ref. 49). 24–30 h after transfection, cells were treated with either 2ME2 (4.4 μm, 16 h) or vehicle. Subsequently, cells were fed Alexa-555-labeled α-Myc (9E10) antibodies (20 μg/ml, 20 min, 37 °C) before being cooled and labeled with Alexa-488 goat-α-mouse (20 μg/ml, 60 min, 4 °C). The entire cell volume of cells was acquired by confocal microscopy. Intensity-based segmentation was employed for signal identification, and co-localized signal-positive pixels were determined with SlidebookTM. Bar, 5 μm. B, graph depicts the average ± S.E. of internal to total ratio of the Alexa-555 signal, from three independent experiments (a total of ∼60 cells per condition). C, ES-2 cells, doubly transfected with TβRI-LDLR or TβRI-158 and p82-WT-h or p82-5A, were treated and processed as in A. Panels depict typical cells in each condition. Bar, 5 μm. D, graph depicts the average ± S.E. of internal to total ratio of the Alexa-555 signal, from two independent experiments (a total of 30–40 cells per condition; ***, p < 9E-9; **, p < 4E-3; *, p < 5E-2).

Similar articles

Cited by

References

    1. Wang Z., Tseng C. P., Pong R. C., Chen H., McConnell J. D., Navone N., Hsieh J. T. (2002) J. Biol. Chem. 277, 12622–12631 - PubMed
    1. Cho S. Y., Jeon J. W., Lee S. H., Park S. S. (2000) Biochem. J. 352, 645–650 - PMC - PubMed
    1. Huang C. H., Cheng J. C., Chen J. C., Tseng C. P. (2007) Cell. Signal. 19, 1339–1347 - PubMed
    1. Xu X. X., Yi T., Tang B., Lambeth J. D. (1998) Oncogene 16, 1561–1569 - PubMed
    1. Zhou J., Hsieh J. T. (2001) J. Biol. Chem. 276, 27793–27798 - PubMed

Publication types

MeSH terms