. 2011 Jan 28;286(4):2461-8.
doi: 10.1074/jbc.M110.203935. Epub 2010 Nov 19.

Myristoylation of cGMP-dependent protein kinase dictates isoform specificity for serotonin transporter regulation

Affiliations

Myristoylation of cGMP-dependent protein kinase dictates isoform specificity for serotonin transporter regulation

Yuan-Wei Zhang et al. J Biol Chem. .

Abstract

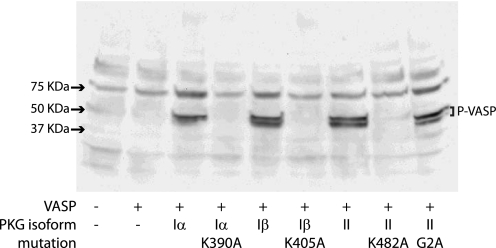
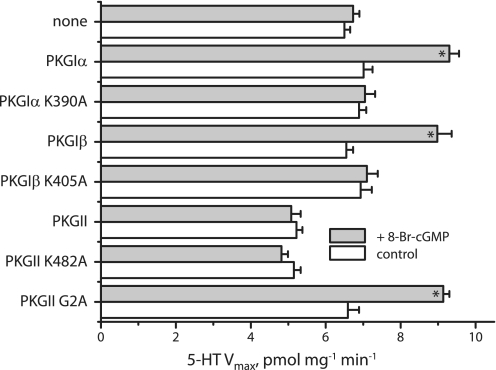
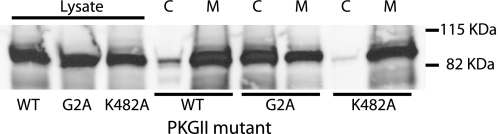
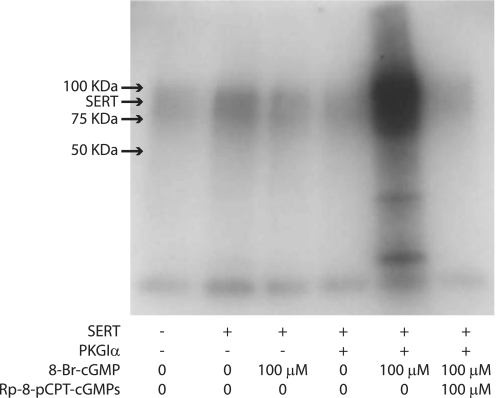
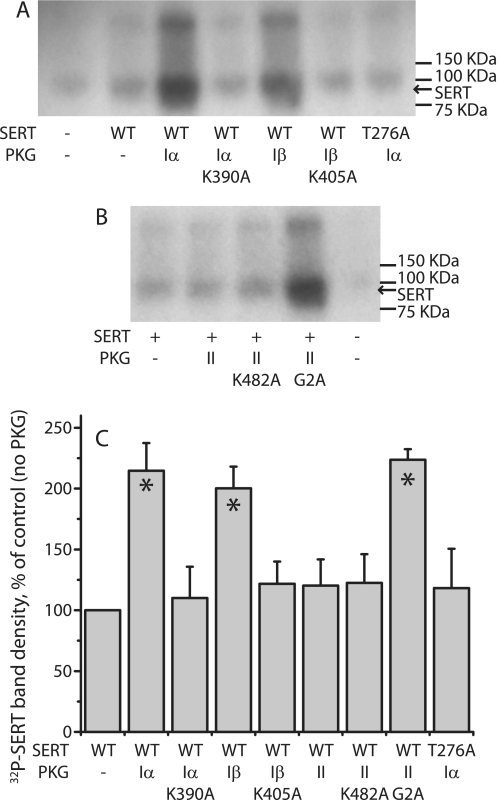
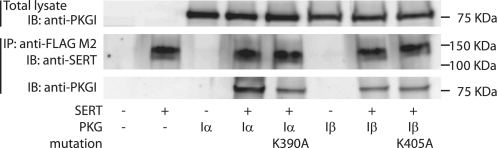
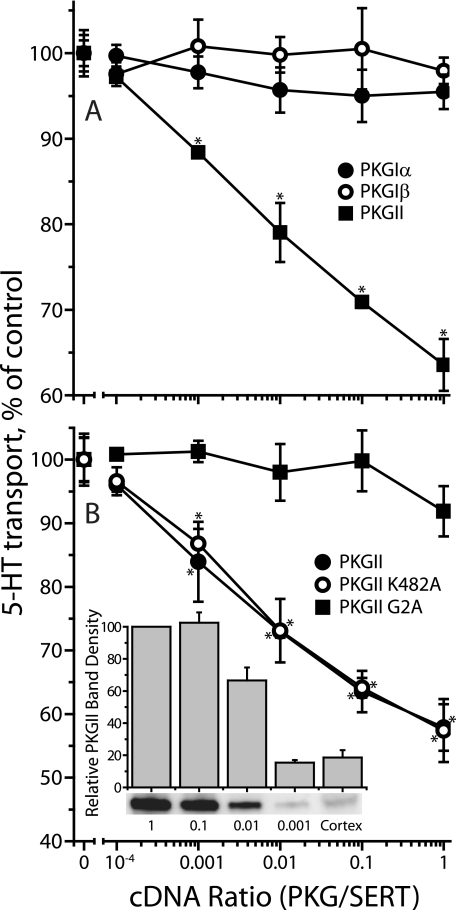
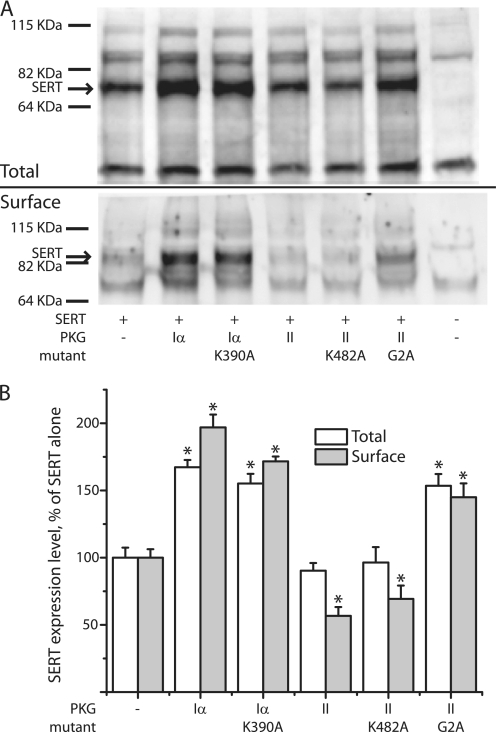
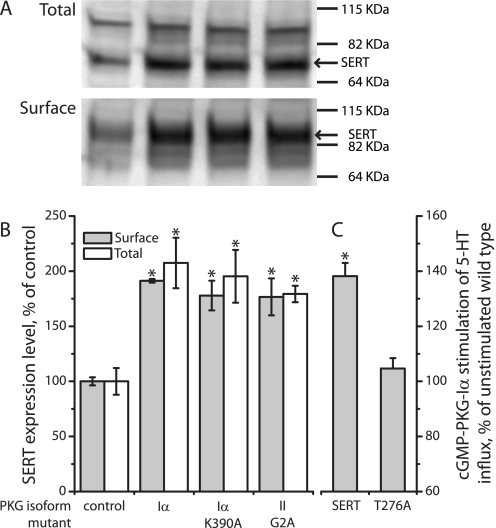
By transporting serotonin (5-HT) into neurons and other cells, serotonin transporter (SERT) modulates the action of 5-HT at cell surface receptors. SERT itself is modulated by several processes, including the cGMP signaling pathway. Activation of SERT by cGMP requires the cGMP-dependent protein kinase (PKG). Here we show that in HeLa cells lacking endogenous PKG, expression of PKGIα or PKGIβ was required for 8-bromoguanosine-3',5'-cyclic monophosphate (8-Br-cGMP) to stimulate SERT phosphorylation and 5-HT influx. Catalytically inactive PKG mutants and wild-type PKGII did not support this stimulation. However, a mutant PKGII (G2A) that was not myristoylated substituted for functional PKGI, suggesting that myristoylation and subsequent membrane association blocked productive interaction with SERT. PKG also influenced SERT expression and localization. PKGI isoforms increased total and cell surface SERT levels, and PKGII decreased cell surface SERT without altering total expression. Remarkably, these changes did not require 8-Br-cGMP or functional kinase activity and were also observed with a SERT mutant resistant to activation by PKG. Both PKGIα and PKGIβ formed detergent-stable complexes with SERT, and this association did not require catalytic activity. The nonmyristoylated PKGII G2A mutant stimulated SERT expression similar to PKGI isoforms. These results suggest multiple mechanisms by which PKG can modulate SERT and demonstrate that the functional difference between PKG isoforms results from myristoylation of PKGII.


Figures

FIGURE 1.
FIGURE 1.
VASP phosphorylation by functional PKG isoforms. PKG-deficient HeLa cells were transfected with cDNAs encoding VASP together with PKGIα, PKGIβ, PKGII, and various kinase mutants as indicated. The leftmost lane indicates nontransfected cells. After a 22-h incubation, the cells were incubated with 100 μm 8-Br-cGMP at 37 °C for 30 min prior to solubilization. Solubilized proteins were subjected to SDS-PAGE and Western blot analysis using an anti-phospho-VASP antibody. The blot shown is a representative of three experiments.
FIGURE 2.
FIGURE 2.
PKG requirement for 8-Br-cGMP stimulation of SERT Vmax. PKG-deficient HeLa cells transfected with SERT and individual PKG isoforms or their mutants as indicated were incubated for 30 min at 37 °C in the presence or absence of 100 μm 8-Br-cGMP. 5-HT influx was measured over a concentration range of 0.02–5 μm [3H]5-HT, and Km and Vmax values were determined. The results represent Vmax data from at least three experiments. Error bars indicate standard errors from at least three independent measurements. The asterisks indicate Vmax values significant increased by 8-Br-cGMP (p < 0.05, paired Student's t test).
FIGURE 3.
FIGURE 3.
Membrane association of PKGII and its mutants. HeLa cells expressing wild-type PKGII and mutants G2A and K482A were fractionated into cytosolic and membrane fractions as described under “Experimental Procedures,” solubilized, and separated by SDS-PAGE. PKGII was detected by immunoblotting with a polyclonal antibody. The leftmost three lanes were homogenates from cells expressing wild-type PKGII and G2A and K482A mutants. The remaining lanes show the cytosolic (C) and membrane (M) fractions of wild-type (WT), G2A, and K482A. Each sample contained 20 μg of protein. The distribution of protein between cytosolic and membrane fractions was 126–180 μg for wild type, 148–163 μg for G2A, and 134–188 μg for K482A.
FIGURE 4.
FIGURE 4.
PKGIα catalyzed 32P incorporation into SERT. HeLa cells expressing C-terminal FLAG-tagged SERT alone or with wild-type PKGIα were incubated with 1.0 mCi/ml 32Pi for 60 min, and then 8-Br-cGMP was added at a concentration of 100 μm as indicated and incubated for an additional 30 min. The specific PKG inhibitor, Rp-8-pCPT-cGMPs, was added where indicated at a concentration of 100 μm and incubated for 30 min prior to 8-Br-cGMP treatment. The cells were then washed and solubilized, and SERT was captured by immunoprecipitation as described under “Experimental Procedures.” 32P incorporation into SERT was detected by autoradiography. The mobility of the principal SERT band in Figs. 4 and 5 corresponds to a molecular mass of about 95 kDa.
FIGURE 5.
FIGURE 5.
PKG isoform specificity for SERT phosphorylation. A and B, HeLa cells were transfected with C-terminal FLAG-tagged SERT wild type or T276A together with PKGI (A) or PKGII (B) isoforms or catalytically inactive mutants. Cells were metabolically labeled with 32Pi for 60 min, 100 μm 8-Br-cGMP was added, and the cells were incubated for 30 min followed by immunoprecipitation as described in the Fig. 4 legend. The autoradiograms shown are representative of three experiments. C, quantitation of phospho-SERT band densities is shown. Relative intensities of 32P-labeled SERT bands were averages from three phosphorylation experiments. Values are expressed as mean ± S.E. (error bars). Asterisks indicate significant differences compared with SERT alone (p < 0.05).
FIGURE 6.
FIGURE 6.
Co-immunoprecipitation of PKGI with FLAG-tagged SERT. Cells expressing SERT with PKGIα and Iβ isoforms and mutants as indicated were solubilized, and a small portion of the lysates was analyzed for total expression of PKGI by Western blotting (IB) using anti-PKGI antibody (top panel). The remaining lysates were immunoprecipitated (IP) using an anti-FLAG M2 antibody as described under “Experimental Procedures,” and analyzed by Western blotting using SERT-specific antibody (middle panel) or anti-PKGI antibody (bottom panel). The blots shown are representatives of two experiments. In this co-immunoprecipitation procedure (different from the procedure used in Figs. 4 and 5), the principal SERT band migrates with an anomalously high apparent mass of 100–150 kDa.
FIGURE 7.
FIGURE 7.
Effect of PKG co-expression on SERT activity. HeLa cells were transfected with a constant amount of SERT cDNA (0.125 μg/well in 96-well plates) with a varying amount of cDNA (0–0.125 μg/well) encoding (A) PKGIα (filled circles), PKGIβ (open circles), or PKGII (filled squares) or (B) PKGII wild type (open circles), PKGII K482A (filled squares) or PKGII G2A (filled circles). After incubation for 22 h, SERT transport activity was assayed in the absence of 8-Br-cGMP by adding 20 nm [3H]5-HT and incubating for 10 min at room temperature as described under “Experimental Procedures.” The results represent data from three experiments with triplicate determinations. Error bars indicate S.E. of the means from the three determinations. Points marked with an asterisk were found to be statistically different (p < 0.05) from control (SERT alone). Inset, expression of PKGII in HeLa cells compared with native expression in mouse cerebral cortex. Samples (20 μg, corresponding to ∼104 cells) of the transfected cells used in B, along with the same amount of cell homogenate from mouse cerebral cortex, were separated by SDS-PAGE, and stained for PKGII immunoreactivity. The bands below the columns are from a typical measurement, and the columns and error bars represent means ± S.E. from quantification of three experiments.
FIGURE 8.
FIGURE 8.
Effects of PKG isoforms on SERT expression. A, Western blots of SERT expression in cells co-expressing the indicated PKG isoforms and mutants are shown. Cells were transfected with equal amounts (1 μg/well) of SERT and PKG cDNAs. Total (upper panel) and cell surface (lower panel) SERT expression was detected by Western blotting with anti-SERT antibody. Total expression was measured in detergent extracts of whole cells. For measurement of surface expression, cells were treated with sulfo-NHS-SS-biotin to label cell surface proteins, solubilized, and the biotinylated fraction was extracted with streptavidin beads. The blots shown are representatives of three experiments. B, from the relative integrated density of SERT bands (the 68 kDa band for total SERT and the 95 kDa band for surface SERT), the expression levels of SERT were estimated as a percentage of SERT expression alone. Asterisks indicate values significantly different (p < 0.05) from that of control (SERT alone). Samples contained 20 μg total protein, corresponding to 104 cells. Samples of surface proteins contained all of the biotinylated protein recovered from an initial sample of 800 μg of protein, corresponding to 4 × 10⁵ cells.
FIGURE 9.
FIGURE 9.
SERT T276A expression was influenced by PKG isoforms. Total and surface expression of SERT T276A was measured as in Fig. 8. A, Western blots of total and surface expression of T276A co-expressed with PKGIα, the catalytically inactive mutant K390A and the nonmyristoylated PKGII mutant G2A. B, quantification of the Western blot results estimated as a percentage of SERT expression alone. Asterisks indicate values significantly different (p < 0.05) from that of control (T276A alone). C, cells co-expressing PKGIα with wild-type or T276A SERT incubated with or without 100 μm 8-Br-cGMP at 37 °C for 30 min. Transport was then measured as described under “Experimental Procedures” and was estimated as a percentage of SERT activity without 8-Br-cGMP treatment. Error bars indicate standard error of the means from three experiments. Asterisks indicate values significantly different (p < 0.05) from that of control (without 8-Br-cGMP treatment). Sample amounts were similar to those in Fig. 8.

References

    1. Murphy D. L., Andrews A. M., Wichems C. H., Li Q., Tohda M., Greenberg B. (1998) J. Clin. Psychiatry 59, Suppl. 15, 4–12 - PubMed
    1. Stahl S. M. (1998) J. Affect. Disorders 51, 215–235 - PubMed
    1. Qian Y., Galli A., Ramamoorthy S., Risso S., DeFelice L. J., Blakely R. D. (1997) J. Neurosci. 17, 45–57 - PMC - PubMed
    1. Ramamoorthy S., Cool D. R., Mahesh V. B., Leibach F. H., Melikian H. E., Blakely R. D., Ganapathy V. (1993) J. Biol. Chem. 268, 21626–21631 - PubMed
    1. Jayanthi L. D., Ramamoorthy S., Mahesh V. B., Leibach F. H., Ganapathy V. (1994) J. Biol. Chem. 269, 14424–14429 - PubMed

Publication types

MeSH terms

LinkOut - more resources