. 2011 Jan 21;286(3):2111-20.
doi: 10.1074/jbc.M110.154971. Epub 2010 Nov 19.

Tumor-secreted PGE2 inhibits CCL5 production in activated macrophages through cAMP/PKA signaling pathway

Affiliations

Tumor-secreted PGE2 inhibits CCL5 production in activated macrophages through cAMP/PKA signaling pathway

Xuesong Qian et al. J Biol Chem. .

Abstract

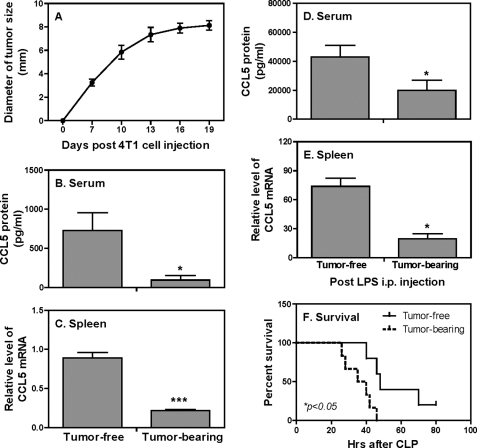
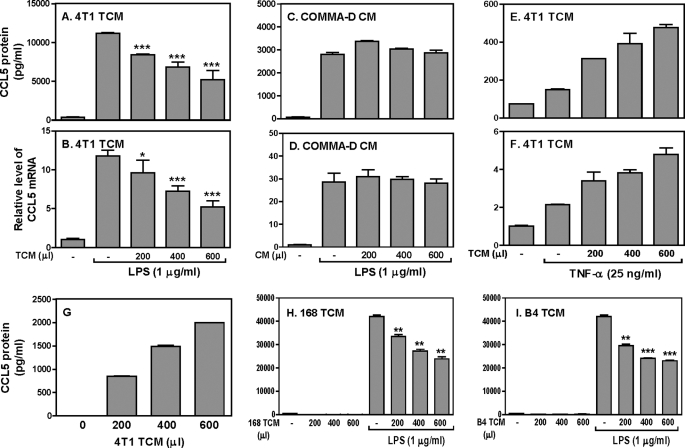
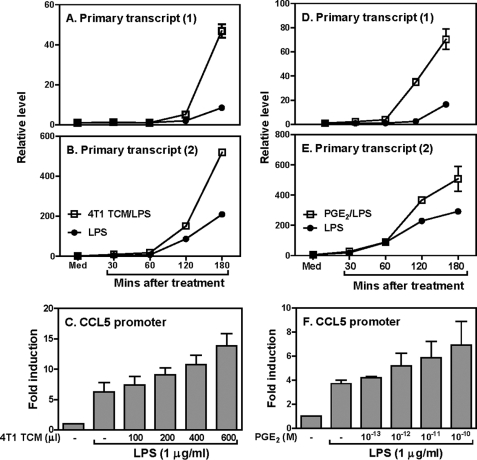
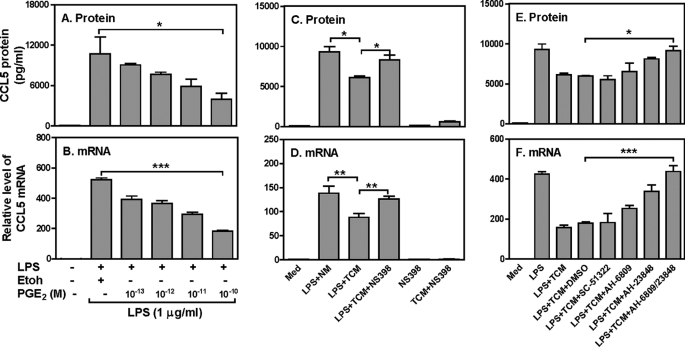
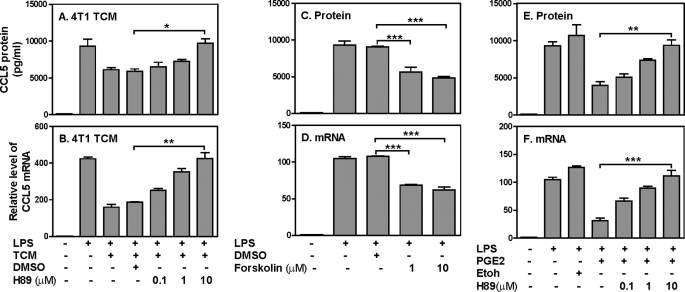
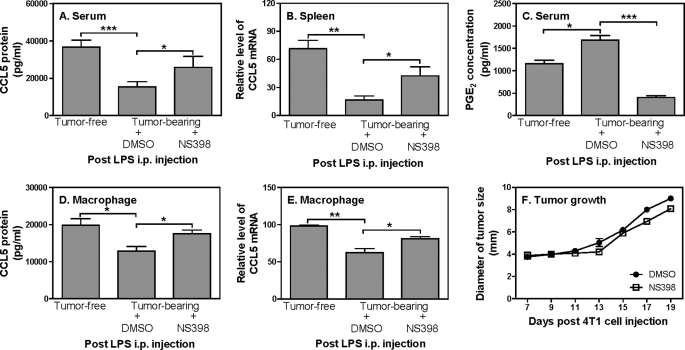
One of the major characteristics of tumors is their ability to evade immunosurveillance through altering the properties and functions of host stromal and/or immune cells. CCL5 has been shown to play important roles in T cell proliferation, IFN-γ, and IL-2 production, which promotes the differentiation and proliferation of Th1 cells important for immune defense against intracellular infection. In this study we found that tumor-bearing mice were more susceptible to bacterial infection and showed reduced CCL5 levels in serum during endotoxic shock. Our data further demonstrated that the soluble factors secreted by mammary gland tumor cells but not normal mammary gland epithelial cells inhibited CCL5 expression in macrophages in response to LPS, but not to TNF-α stimulation. The inhibitory effect of tumor-secreted molecules on LPS-induced CCL5 expression was regulated at the post-transcriptional level. Blocking PGE(2) synthesis by NS398 or through the use of PGE(2) receptor antagonists AH-6809 (EP2 antagonist) and AH-23848 (EP4 antagonist) completely reversed the inhibitory effect of tumor-conditioned medium (TCM) on LPS-induced CCL5 expression. Moreover, PGE(2) and the cAMP analog forskolin could mimic tumor-mediated CCL5 inhibition, and the inhibitory effects of TCM, PGE(2), and cAMP analog on LPS-induced CCL5 expression could be completely reversed by the PKA inhibitor H89. Furthermore, blocking PGE(2) synthesis in vivo led to partial recovery of CCL5 production during endotoxic shock. Taken together, our data indicate that PGE(2) secreted from breast cancer cells suppresses CCL5 secretion in LPS-activated macrophages through a cAMP/PKA signaling pathway, which may result in suppression of host immune responses against subsequent bacterial infection.


Figures

FIGURE 1.
FIGURE 1.
CCL5 protein and mRNA expression are impaired in tumor-bearing mice during endotoxic shock. A, 1 × 10⁵ 4T1 tumor cells were injected s.c. in the abdominal mammary gland of female Balb/c mice. Tumor size in diameter (horizontal and vertical) was measured. 19 days after 4T1 cell injection, tumor-free and tumor-bearing mice were either left untreated (B and C) or injected intraperitoneal with LPS (25 mg/kg) (D and E). Four hours after LPS injection, mice were sacrificed, and serum was collected for measurement of CCL5 protein production by ELISA (B and D). Meanwhile spleens were used to extract total RNA for detection of CCL5 mRNA expression by qRT-PCR (C and E). qRT-PCR data were normalized relative to GAPDH mRNA expression levels in each respective sample and further normalized to the sample from the tumor-free group, which was set as 1. *, p < 0.05 and ***, p < 0.001 between two groups. Data shown represent one of three experiments with similar results and 10 mice in each group. F, 19 days after 4T1 cell injection, CLP was performed on tumor-free and tumor-bearing mice (n = 7 for each group) and survival was closely monitored in every 2 h. Data shown represent one of two experiments with similar results.
FIGURE 2.
FIGURE 2.
4T1 tumor-conditioned medium inhibits LPS-induced CCL5 protein and mRNA expression in mouse macrophages. 1 × 10⁶ RAW cells were stimulated with LPS (1 μg/ml) plus different amounts of 4T1 TCM as indicated for different times, followed by collection of culture supernatants (24 h after treatment) and total RNA (4 h after treatment) for measurement of CCL5 protein production by ELISA (A) and mRNA expression by qRT-PCR (B), respectively. 1 × 10⁶ RAW cells were stimulated with LPS (1 μg/ml) in the absence or presence of different amounts of culture supernatants collected from the CommaD Bgeo cells as indicated to detect CCL5 protein (24 h after treatment) and mRNA expression (4 h after treatment) by ELISA (C) and qRT-PCR (D), respectively. The same number of RAW cells were stimulated with TNF-α (25 ng/ml) in the absence or presence of different amounts of 4T1 TCM as indicated to detect CCL5 protein (24 h after treatment) and mRNA expression (8 h after treatment) by ELISA (E) and qRT-PCR (F), respectively. G, different amounts of 4T1 TCM as indicated were directly used to measure the CCL5 protein levels by ELISA. Different amounts of conditioned medium collected from 168 (H) and B4 (I) tumor cells as indicated were either used directly or added to 1 × 10⁶ RAW cells stimulated with LPS (1 μg/ml) for 24 h for measurement of CCL5 protein production in supernatants by ELISA. All data shown are means plus S.D. from three different experiments. *, p < 0.05; **, p < 0.01 between LPS-stimulated group and groups treated with LPS plus various amounts of TCM.
FIGURE 3.
FIGURE 3.
Inhibition of LPS-induced CCL5 expression by TCM is regulated at the post-transcriptional level. CCL5 gene primary transcript was measured by qRT-PCR using PT-1 (A) and PT-2 (B) primers. Data were normalized relative to GAPDH gene expression levels in each respective sample and further normalized to the results from the untreated group (Med), which was set as 1. C, 10 × 106 RAW cells were transiently transfected with 5 μg of mouse CCL5 luciferase reporter construct as previous published (48). The transfected cells were stimulated with different amounts of 4T1 TCM as indicated for 7 h in the presence of LPS (1 μg/ml), followed by measurement of luciferase activity. 3 × 10⁶ RAW cells were stimulated with LPS (1 μg/ml) plus 1 × 10⁻¹⁰ m PGE2 for different times as indicated, followed by extraction of total RNA to measure the CCL5 gene primary transcript as described above (D and E). 10 × 106 RAW cells were transiently transfected with 5 μg mouse CCL5 luciferase reporter construct as described above and the transfected cells were stimulated with different amounts of PGE2 as indicated for 7 h in the presence of LPS (1 μg/ml), followed by measurement of luciferase activity (F). Luciferase data were normalized to the activity obtained with non-treated cells and represented as fold induction. All data shown are means plus S.D. of three-four experiments.
FIGURE 4.
FIGURE 4.
The inhibitory effect of TCM on CCL5 expression is mediated by tumor-secreted PGE2. 1 × 10⁶ RAW cells were stimulated with LPS (1 μg/ml) and various concentrations of PGE2 as indicated for different times to measure CCL5 protein (24 h after treatment) by ELISA (A) and mRNA expression (4 h after treatment) by qRT-PCR (B), respectively. PGE2 was dissolved in ethanol and added to a final concentration as indicated (each contained 0.01% ethanol in final concentration). 1 × 10⁶ RAW cells were cultured with normal media (NM), 400 μl/ml of 4T1 TCM, or 400 μl/ml of TCM collected from 4T1 cells treated with NS398 in the presence or absence of LPS (1 μg/ml) for 4 h. Note that in the fifth and sixth bar from the left, NS398 was added to the macrophage culture, not to the 4T1 culture. CCL5 protein production and mRNA expression were measured by ELISA (C) and qRT-PCR (D), respectively. 1 × 10⁶ RAW cells were pretreated with 10 μm SC51322 (EP1 antagonist), 3 μm AH6809 (EP2 antagonist) and 30 μm AH 23848 (EP4 antagonist) or AH6809 plus Ah23848 for 30 min, then stimulated with LPS (1 μg/ml) and 400 μl 4T1 TCM for different times for detection of CCL5 protein and mRNA expression by ELISA (E) and qRT-PCR (F), respectively. Data shown are means plus S.D. of three-four experiments. qRT-PCR data were normalized relative to GAPDH mRNA expression levels in each respective sample and further normalized to the sample from the untreated group, which was set as 1. *, p < 0.05 and **, p < 0.01 between two groups as indicated.
FIGURE 5.
FIGURE 5.
The inhibitory effect of TCM on CCL5 expression is mediated through cAMP/PKA signaling pathway. 1 × 10⁶ RAW cells were pretreated with various amounts of H89 as indicated for 60 min, then stimulated with LPS (1 μg/ml) and 400 μl 4T1 TCM for different times followed by collection of culture supernatants (24 h after treatment) and total RNA (4 h after treatment) to measure CCL5 protein by ELISA (A) and mRNA expression by qRT-PCR (B), respectively. 1 μm and 10 μm of forskolin were added to LPS-stimulated RAW cells to measure CCL5 protein (24 h after treatment) by ELISA (C) and mRNA expression (4 h after treatment) by qRT-PCR (D), respectively. Same amount of dissolvent, DMSO was used as a negative control. H89 at various concentrations as indicated was added to 1 × 10⁶ RAW cells 60 min prior to LPS (1 μg/ml) and PGE2 (1 × 10⁻¹⁰ m) treatments. CCL5 protein and mRNA expression were measured by ELISA (E) and qRT-PCR (F), respectively. Same amount of ethanol was used as a negative control. Data shown are means plus S.D. of 2–4 independent experiments. qRT-PCR data were normalized relative to GAPDH mRNA expression levels in each respective sample and further normalized to the sample from the untreated group, which was set as 1. ***, p < 0.001 between two groups as indicated.
FIGURE 6.
FIGURE 6.
Blockade of PGE2 synthesis by NS398 in vivo partially recovers CCL5 production in tumor-bearing mice during endotoxic shock. A, 1 × 10⁵ 4T1 tumor cells were injected s.c. in the abdominal mammary gland in 0.1 ml PBS as described previously in Fig. 1. Seven days later, NS398 (10 mg/kg) and an equal amount of DMSO were given intraperitoneal every 3 days for total four times. 19 days post 4T1 cell injection, blood was drawn by cardiac puncture, and serum was collected for measurement of CCL5 concentration by ELISA. Meanwhile spleens were used to extract total RNA for detection of CCL5 mRNA expression by qRT-PCR (B) and the levels of PGE2 in serum were measured (C). Peritoneal macrophages were collected from tumor-free and tumor-bearing mice treated with DMSO and NS398 after LPS injection and cultured for 24h in vitro, followed by collection of culture supernatants to measure CCL5 protein by ELISA (D) or by extraction of total RNA to test CCL5 mRNA expression by qRT-PCR (E). qRT-PCR data were normalized relative to GAPDH mRNA expression levels in each respective sample and further normalized to the sample from the tumor-free group, which was set as 1. F, tumor growth was measured every 2–3 days after 4T1 cell injection in both DMSO and NS398 injected mice as described previously in Fig. 1. Each group includes four mice and data shown represent one of two experiments with similar results.

Similar articles

Cited by

References

    1. Nicolini A., Carpi A. (2009) Med. Res. Rev. 29, 436–471 - PubMed
    1. Baggiolini M. (1998) Nature 392, 565–568 - PubMed
    1. Luster A. D. (1998) N. Engl. J. Med. 338, 436–445 - PubMed
    1. Rollins B. J. (1997) Blood 90, 909–928 - PubMed
    1. Schall T. J., Jongstra J., Dyer B. J., Jorgensen J., Clayberger C., Davis M. M., Krensky A. M. (1988) J. Immunol. 141, 1018–1025 - PubMed

Publication types

MeSH terms

LinkOut - more resources