

High-mannose glycans are elevated during breast cancer progression
- PMID: 21097542
- PMCID: PMC3013453
- DOI: 10.1074/mcp.M110.002717
High-mannose glycans are elevated during breast cancer progression
Abstract
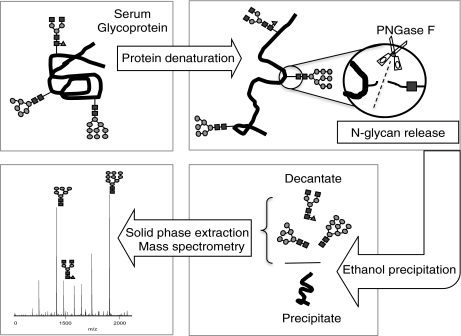
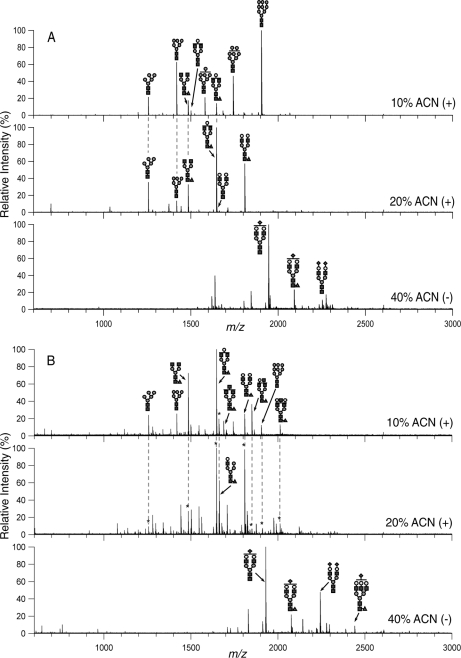
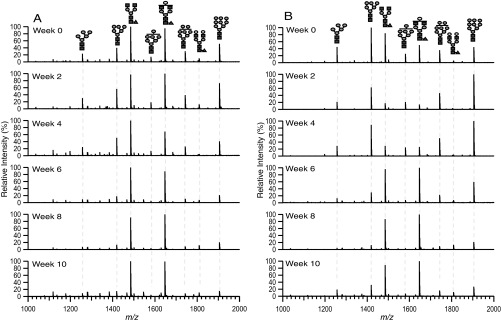
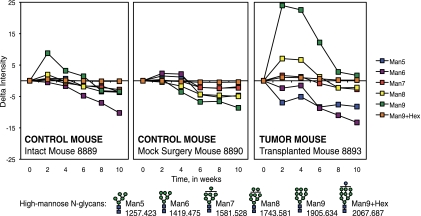
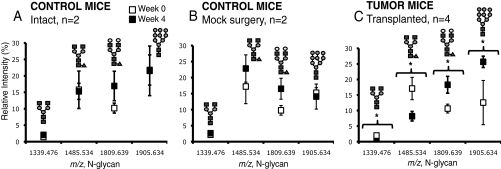
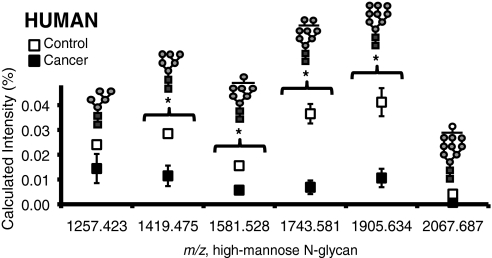
Alteration in glycosylation has been observed in cancer. However, monitoring glycosylation changes during breast cancer progression is difficult in humans. In this study, we used a well-characterized transplantable breast tumor mouse model, the mouse mammary tumor virus-polyoma middle T antigen, to observe early changes in glycosylation. We have previously used the said mouse model to look at O-linked glycosylation changes with breast cancer. In this glycan biomarker discovery study, we examined N-linked glycan variations during breast cancer progression of the mouse model but this time doubling the number of mice and blood draw points. N-glycans from total mouse serum glycoproteins were profiled using matrix-assisted laser desorption/ionization Fourier transform-ion cyclotron resonance mass spectrometry at the onset, progression, and removal of mammary tumors. We observed four N-linked glycans, m/z 1339.480 (Hex(3)HexNAc), 1485.530 (Hex(3)HexNAc(4)Fuc), 1809.639 (Hex(5)HexNAc(4)Fuc), and 1905.630 (Man(9)), change in intensity in the cancer group but not in the control group. In a separate study, N-glycans from total human serum glycoproteins of breast cancer patients and controls were also profiled. Analysis of human sera using an internal standard showed the alteration of the low-abundant high-mannose glycans, m/z 1419.475, 1581.528, 1743.581, 1905.634 (Man(6-9)), in breast cancer patients. A key observation was the elevation of a high-mannose type glycan containing nine mannoses, Man(9), m/z 1905.630 in both mouse and human sera in the presence of breast cancer, suggesting an incompletion of the glycosylation process that normally trims back Man(9) to produce complex and hybrid type oligosaccharides.
Figures
References
-
- Garcia M. J. A., et al. (2007) Global Cancer Facts and Figures 2007. American. Cancer Society, Atlanta, GA
-
- Jemal A., Siegel R., Xu J., Ward E. (2010) Cancer Statistics, 2010. CA Cancer J. Clin. 60, 277–300 - PubMed
-
- Harris L., et al. (2007) American society of clinical oncology 2007 update of recommendations for the use of tumor markers in breast cancer. J. Clin. Oncol. 25, 5287–5312 - PubMed
-
- Safi F., Kohler I., Röttinger E., Beger H. (1991) The value of the tumor marker CA 25–3 in diagnosing and monitoring breast cancer: A comparative study with carcinoembryonic antigen. Cancer 68, 574–582 - PubMed
-
- Seregni E., Coli A., Mazzucca N. (2004) Circulating tumour markers in breast cancer. Eur. J. Nucl. Med. Mol. Imaging 31, 515–522 - PubMed
Publication types
MeSH terms
Substances
Grants and funding
LinkOut - more resources
Full Text Sources
Other Literature Sources
Medical
