. 2011 Mar;39(6):2416-31.
doi: 10.1093/nar/gkq1096. Epub 2010 Nov 19.

Tertiary contacts control switching of the SAM-I riboswitch

Affiliations

Tertiary contacts control switching of the SAM-I riboswitch

Scott P Hennelly et al. Nucleic Acids Res. 2011 Mar.

Abstract

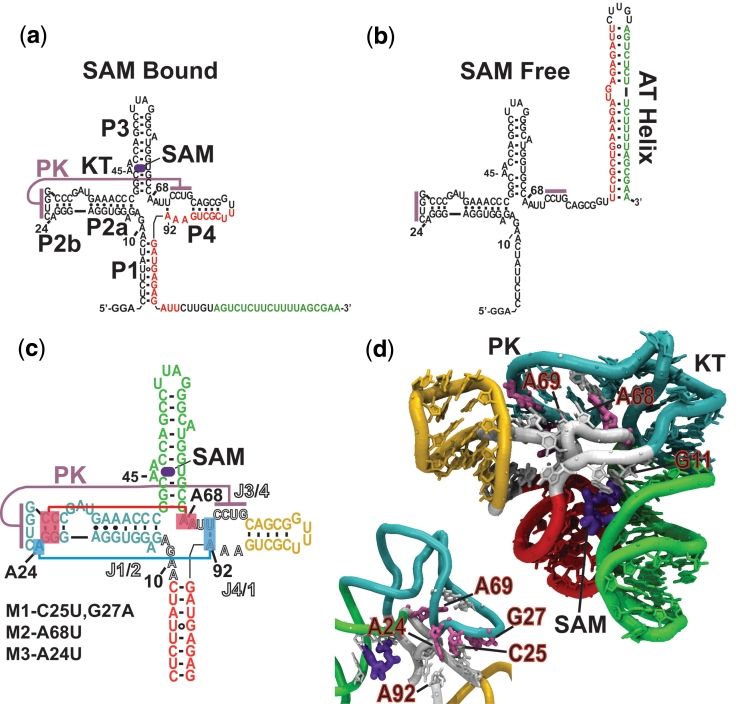
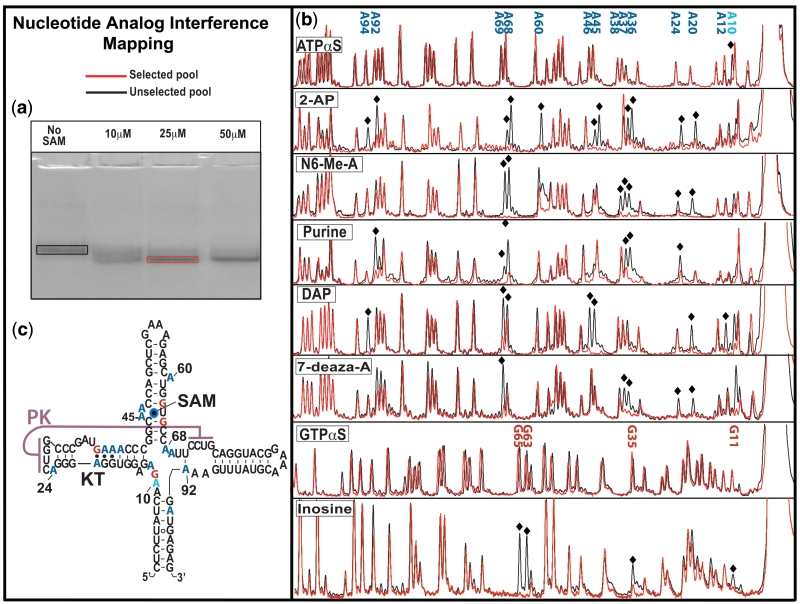
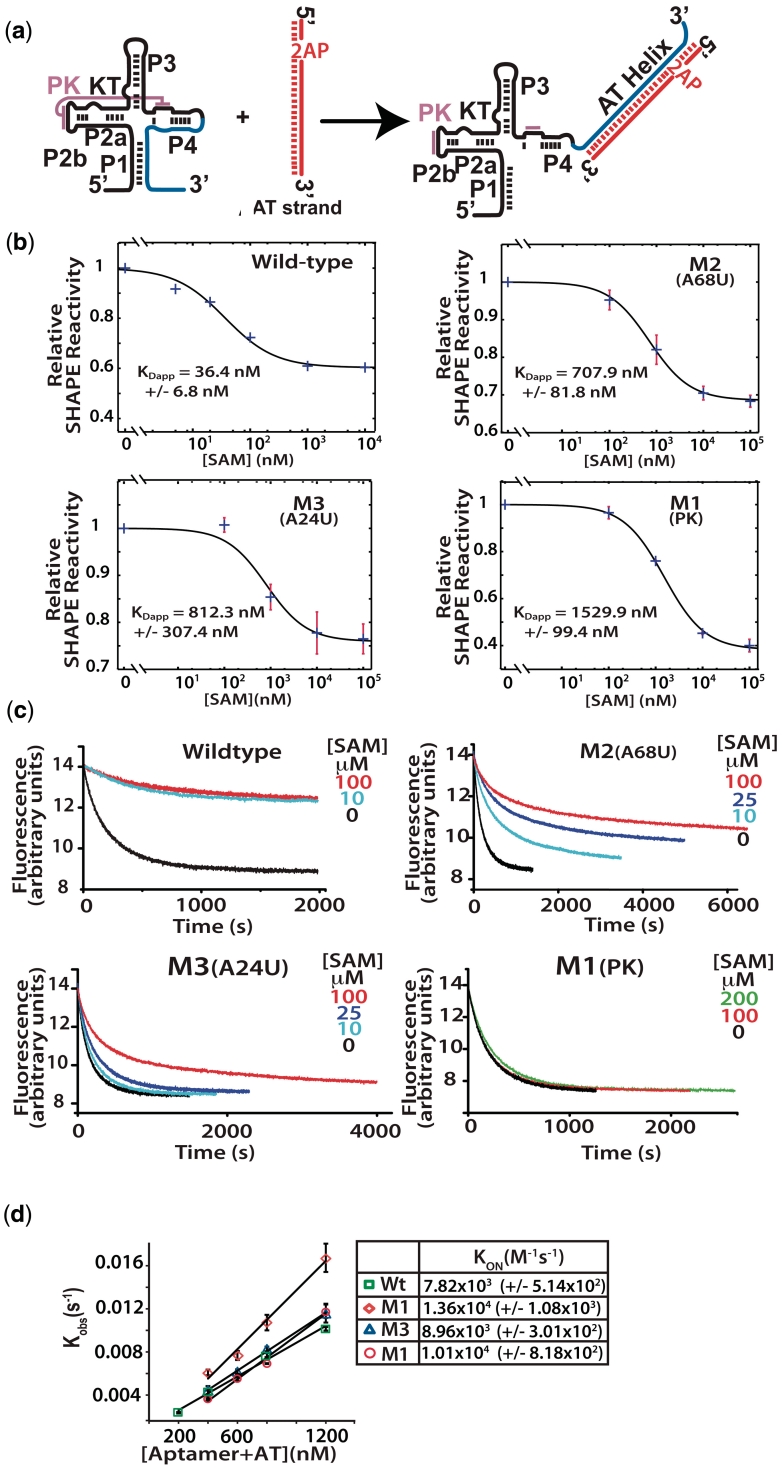
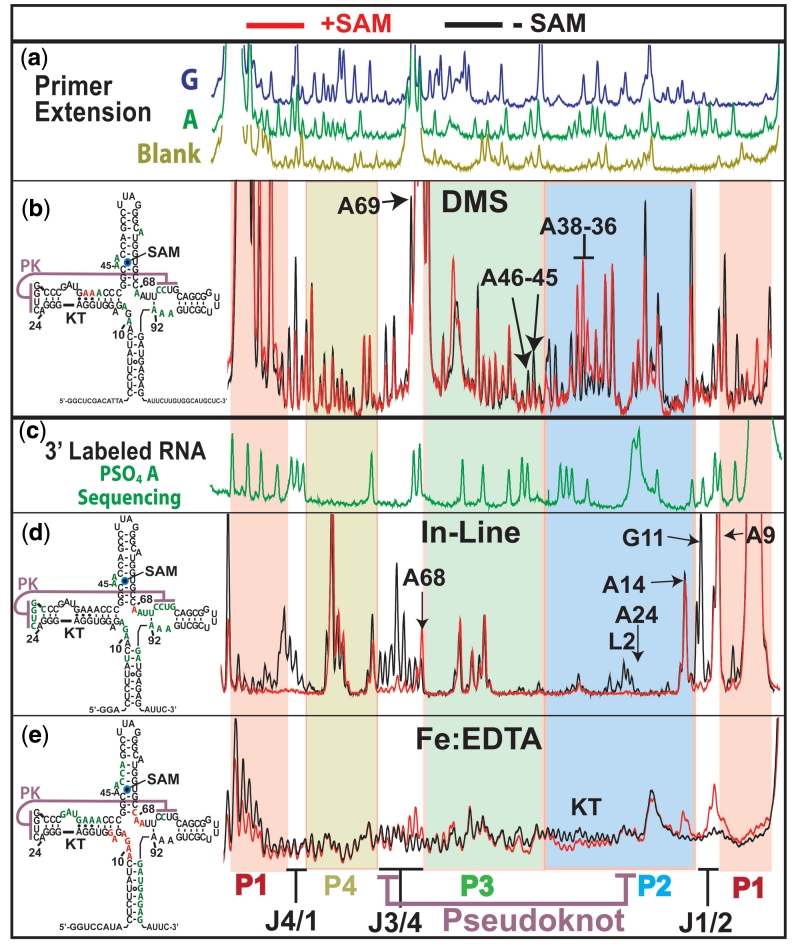
Riboswitches are non-coding RNAs that control gene expression by sensing small molecules through changes in secondary structure. While secondary structure and ligand interactions are thought to control switching, the exact mechanism of control is unknown. Using a novel two-piece assay that competes the anti-terminator against the aptamer, we directly monitor the process of switching. We find that the stabilization of key tertiary contacts controls both aptamer domain collapse and the switching of the SAM-I riboswitch from the aptamer to the expression platform conformation. Our experiments demonstrate that SAM binding induces structural alterations that indirectly stabilize the aptamer domain, preventing switching toward the expression platform conformer. These results, combined with a variety of structural probing experiments performed in this study, show that the collapse and stabilization of the aptamer domain are cooperative, relying on the sum of key tertiary contacts and the bimodal stability of the kink-turn motif for function. Here, ligand binding serves to shift the equilibrium of aptamer domain structures from a more open toward a more stable collapsed form by stabilizing tertiary interactions. Our data show that the thermodynamic landscape for riboswitch operation is finely balanced to allow large conformational rearrangements to be controlled by small molecule interactions.


Figures

Figure 1.
Figure 1.
(a) The T. tencongensis metF SAM I riboswitch. Upon binding SAM the aptamer domain is stabilized sequestering a shared sequence (red) from its complementary expression platform sequence (green). (b) In the absence of SAM there is an irreversible change in the secondary structure when the AT (AT) forms at the expense of the aptamer domain. (c) Secondary structure diagram with lines representing the pseudoknot and flanking base-triple tertiary contacts [helices colour coded to (d)]. Joining regions J1/2, J3/4 and J4/1, are indicated by lettering in outline. Mutant forms of the riboswitch aptamer (M1, M2 and M3) used in this study are indicated. (d) Crystallographic structure of the SAM-I riboswitch aptamer domain of Batey and co-workers (20). Tertiary contacts associated with the pseudoknot (PK) are labelled. Sites mutated are colored salmon and the KT motif facilitating the PK interaction is labelled. Inset is the reverse view showing the PK region. Construct based on the metF riboswitch but containing a truncated P3.
Figure 2.
Figure 2.
NAIM. (a) Native polyacrylamide gel showing the shift in electrophoretic mobility in response to increasing concentrations of SAM in the loaded sample. This ‘collapse’ of the aptamer domain was used as the NAIM selection parameter. Selected or unselected pools were excised from the gels and fluorescently labelled. (b) Selected and unselected pools were analysed by capillary electrophoresis after cleavage at sites of analogue incorporation with molecular iodine. Sites of analogue interference with the process of aptamer domain collapse were chosen by visual comparison of the selected and unselected pools. (c) Secondary structure of the SAM I NAIM construct showing the locations of analogue interference; adenosine analogues in blue, guanosine in red and phosphorothioate interference at A10.
Figure 3.
Figure 3.
(a) Analytical switching construct. 2-Aminopurine incorporated AT strand associates with the aptamer domain forming the AT helix. (b) Fluorescence trace following the quenching of 2-AP by interaction with the wild-type aptamer and mutant aptamers. Association was followed with various concentrations of SAM as indicated. Samples were rapidly mixed at 25°C and 1:1 ratio of aptamer to AT to a final aptamer concentration of 300 nM, excitation was at 310 nm (5 nm slit width) and fluorescence detected at 372 with a 10-nm slit width. (c) Apparent dissociation constants (KDapp) were determined for the wild-type and mutant constructs. SHAPE probing reactions were performed on samples equilibrated in the presence of varying concentrations of SAM. The decreases in reactivity of a selected nucleotide relative to its reactivity in the absence of SAM were plotted versus SAM concentration and fit to a two state binding model (see ‘Materials and Methods’ section). Standard asymptotic errors for the fit are shown. Error bars represent the standard deviation of a minimum of three replica experiments. (d) Initial rates were fit to a single exponential and the observed rate constants plotted as a function of RNA concentration ([aptamer] + [AT strand]) and the second order rate constants (kon) were determined for each construct.
Figure 4.
Figure 4.
Structural probing results for the wild-type aptamer domain. Red capillary electrophoresis traces are probing results in the presence of 10 µM SAM, black are without. Left, 2D structures summarize SAM dependent sites of decreased (green) and increased (red) reactivity. (a) Primer extension dideoxy sequencing reactions, for guanosine (green) and adenosine (blue) and primer extension control in brown. (b) DMS probing results. Capillary electrophoresis traces of primer extension reactions using 5′ fluorescently labelled primers. (c) Green trace shows iodine cleavage pattern of α-phosphorothioate adenosine incorporated RNA. RNA was 3′-labelled with a 3′ fluorescently labelled DNA oligo. (d) In-line probing results using 3′ fluorescently labelled RNA. (e) Fe:EDTA generated hydroxyl radical cleavage pattern from 3′ fluorescently labelled RNA. Bottom, coloured underlay coded for helices and indicating joining regions and pseudoknot interaction and KT.
Figure 5.
Figure 5.
Capillary electrophoresis analysis of structure probing experiments using 3′ fluorescently labelled mutant aptamers. Top, α-phosphorothioate adenosine sequencing same as Figure 4. (a–c) Left, Fluorescence electropherograms for in-line probing of M2, M3 and M1 pseudoknot mutants showing protections patterns with (red) and without (black) 10 µM SAM. Right, secondary structure representation summarizing the probing results for each experiment indicating increasing (red) and decreasing (green) reactivity in response to ligand. (d and e) Traces for Fe:EDTA catalysed hydroxyl radical probing experiments displayed same as above.
Figure 6.
Figure 6.
The effect of ligand interactions on switching. (a) A titration of SAM in the fluorescence based switching assay at a concentration of 100 nM of both aptamer and AT. Concentrations of SAM follow the legend in (b) with the exception of brown which is 500 nM. (b) Overlay of fluorescence based lane traces from native polyacrylamide gel electrophoresis analysis of equilibrium switching study. (c) Traces from (b) were integrated and the fraction of aptamer associated AT relative to the sample with no SAM was calculated and plotted versus SAM concentration and rectangular hyperbola fit. Arrows indicate the concentration at which 50% of the aptamer was associated, ∼250 nM. (d) Trace showing that the full formation of the AT helix is essentially irreversible by SAM interactions alone. Switching assay performed with the aptamer domain (5 nM) labelled on the 5′ with Cy-5 and the 3′-terminus with Cy-3. In the aptamer conformation the fluorescent dyes FRET strongly (excitation 535 nm, emission 670 nM). As the unlabelled AT (1 µM) associates the dyes are separated and go to a low FRET state. After the association reaction was allowed to proceed to ∼80% completion, SAM was added to a concentration of 1 mM (indicated by arrow). The failure to recover any FRET intensity indicates the aptamer is not reforming at the expense of the AT helix.
Figure 7.
Figure 7.
The outcome for genetic regulation is determined following the synthesis of the aptamer domain. Here, SAM binding shifts the equilibrium of pseudoknot associated contacts toward engagement (top pathway). The contacts provide aptamer stability leading to the continued exclusion of the AT strand following its elongation. In the absence of SAM binding the AT strand is free to compete with an unstablized open conformation of the aptamer leading to the formation of the AT helix (lower pathway).

Similar articles

Cited by

References

    1. Winkler W, Nahvi A, Breaker RR. Thiamine derivatives bind messenger RNAs directly to regulate bacterial gene expression. Nature. 2002;419:952–956. - PubMed
    1. Grundy FJ, Henkin TM. The S box regulon: a new global transcription termination control system for methionine and cysteine biosynthesis genes in gram-positive bacteria. Mol. Microbiol. 1998;30:737–749. - PubMed
    1. McDaniel BA, Grundy FJ, Artsimovitch I, Henkin TM. Transcription termination control of the S box system: direct measurement of S-adenosylmethionine by the leader RNA. Proc. Natl Acad. Sci. USA. 2003;100:3083–3088. - PMC - PubMed
    1. Epshtein V, Mironov AS, Nudler E. The riboswitch-mediated control of sulfur metabolism in bacteria. Proc. Natl Acad. Sci. USA. 2003;100:5052–5056. - PMC - PubMed
    1. Winkler WC, Nahvi A, Sudarsan N, Barrick JE, Breaker RR. An mRNA structure that controls gene expression by binding S-adenosylmethionine. Nat. Struct. Biol. 2003;10:701–707. - PubMed

Publication types