. 2011 Jan;39(Database issue):D677-84.
doi: 10.1093/nar/gkq989. Epub 2010 Nov 19.

KaPPA-View4: a metabolic pathway database for representation and analysis of correlation networks of gene co-expression and metabolite co-accumulation and omics data

Affiliations

KaPPA-View4: a metabolic pathway database for representation and analysis of correlation networks of gene co-expression and metabolite co-accumulation and omics data

Nozomu Sakurai et al. Nucleic Acids Res. 2011 Jan.

Abstract

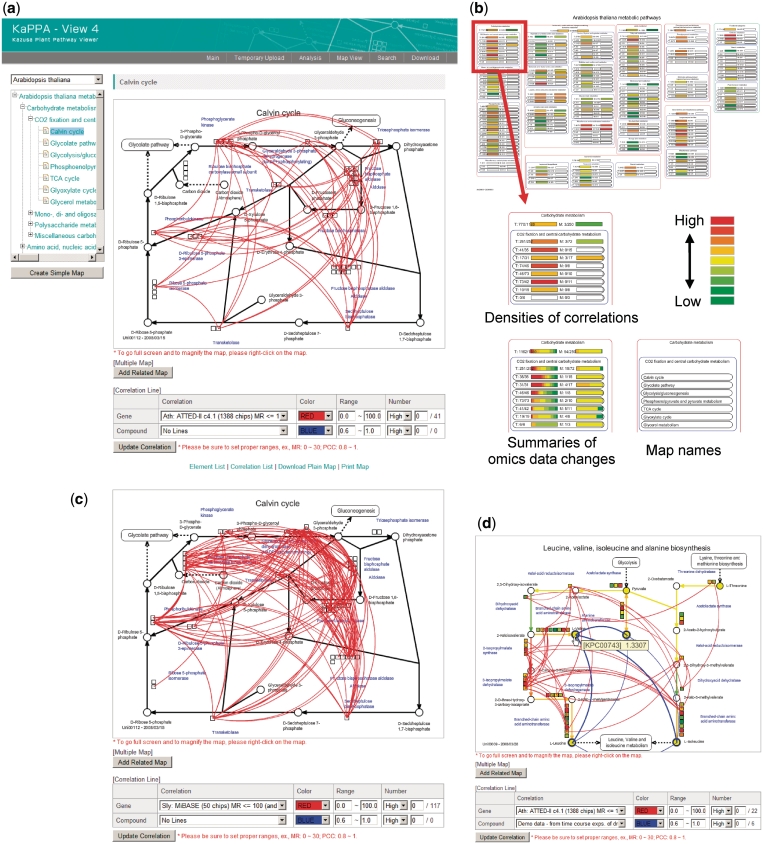
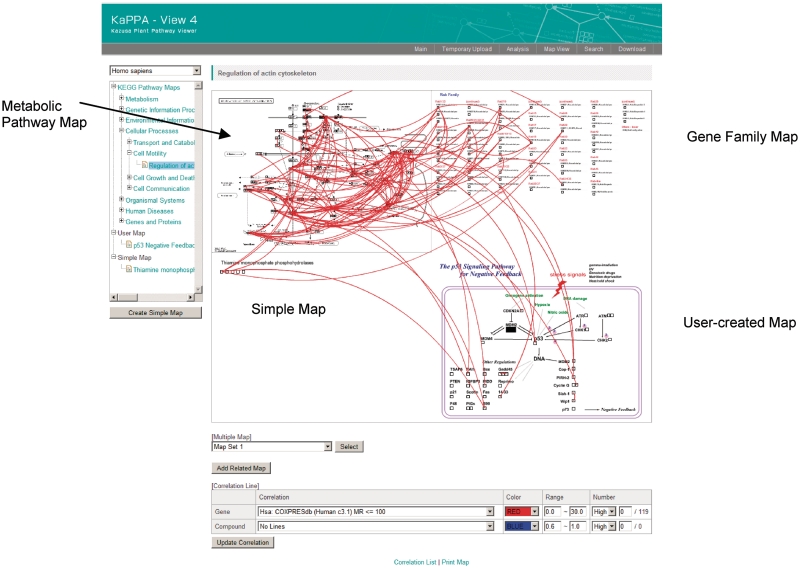
Correlations of gene-to-gene co-expression and metabolite-to-metabolite co-accumulation calculated from large amounts of transcriptome and metabolome data are useful for uncovering unknown functions of genes, functional diversities of gene family members and regulatory mechanisms of metabolic pathway flows. Many databases and tools are available to interpret quantitative transcriptome and metabolome data, but there are only limited ones that connect correlation data to biological knowledge and can be utilized to find biological significance of it. We report here a new metabolic pathway database, KaPPA-View4 (http://kpv.kazusa.or.jp/kpv4/), which is able to overlay gene-to-gene and/or metabolite-to-metabolite relationships as curves on a metabolic pathway map, or on a combination of up to four maps. This representation would help to discover, for example, novel functions of a transcription factor that regulates genes on a metabolic pathway. Pathway maps of the Kyoto Encyclopedia of Genes and Genomes (KEGG) and maps generated from their gene classifications are available at KaPPA-View4 KEGG version (http://kpv.kazusa.or.jp/kpv4-kegg/). At present, gene co-expression data from the databases ATTED-II, COXPRESdb, CoP and MiBASE for human, mouse, rat, Arabidopsis, rice, tomato and other plants are available.


Figures

Figure 1.
Figure 1.
Representation of correlation networks on metabolic pathway maps in KaPPA-View4 Classic. (a) Curves representing gene-to-gene correlations (red) are overlaid on the pathway map of the Calvin Cycle in Arabidopsis. Co-expression data from ATTED-II (MR ≤ 100) was selected. The pathway tree for selecting a map to view is placed on the left. (b) A Bird’s Eye Map of KaPPA-View4 is displayed by clicking a node of the pathway tree. Nodes (pathway groups) are depicted as round rectangles and each metabolic pathway map included in a group is indicated as a round rectangle in the round rectangle. The density of the correlation curves for each map is represented by a color scale. Summaries of the omics data and pathway names of the bars can also be shown. (c) Map of the Calvin Cycle for tomato overlaid with the gene co-expression data of tomato. Co-expression data from MiBASE (MR ≤ 100) was selected. One to several genes for most of the reactions were co-expressed with each other as with those in Arabidopsis shown in (a). (d) Metabolite-to-metabolite correlations can be represented on the maps simultaneously with gene co-expression, transcriptome and metabolome data. The sample data installed in KaPPA-View4 Classic are represented on the map of leucine, valine, isoleucine and alanine biosynthesis. The detail of how the figures are produced on the KaPPA-View4 system is shown in Supplementary Data Section 4.
Figure 2.
Figure 2.
Representation of correlation networks on a combination of four maps (Multiple Map mode) in KaPPA-View4 KEGG. The correlation curves are drawn across the maps. The gene co-expression data from COXPRESdb for human (c3.1, MR ≤ 30) was selected. The map ‘Regulation of actin cytoskeleton’ from the KEGG Pathway was placed at the top-left as an example of a metabolic pathway map. The map for Rab family proteins is an example of a gene family map generated from the KEGG BRITE classification (top-right). A Simple map was created by the gene IDs for thiamine monophosphate phosphohydrolases (bottom-left). A user map depicting p53 negative feedback (bottom-right) was created by the free SVG drawing software Inkscape 0.47 (www.inkscape.org). The detail of how the figure is produced on the KaPPA-View4 system is shown in Supplementary Data Section 4.
Figure 3.
Figure 3.
Comparative representation of transcriptome and metabolome data between Arabidopsis and rice in the Universal Map mode. The species to be represented on the maps can be selected using the ‘Select Species’ button below the pathway diagram. The data for both species were randomly generated as examples, and the values are represented as colors. In the rectangles for the enzyme reactions, both of the genes from Arabidopsis (Ath) and rice (Osa) are represented. The metabolome data from Arabidopsis is represented in the upper part of the circles for the metabolites, and the data from rice is in the lower part. The detail of how the figure is produced on the KaPPA-View4 system is shown in Supplementary Data Section 4.

Similar articles

Cited by

References

    1. Aoki K, Ogata Y, Shibata D. Approaches for extracting practical information from gene co-expression networks in plant biology. Plant Cell Physiol. 2007;48:381–390. - PubMed
    1. Obayashi T, Hayashi S, Shibaoka M, Saeki M, Ohta H, Kinoshita K. COXPRESdb: a database of coexpressed gene networks in mammals. Nucleic Acids Res. 2008;36:D77–D82. - PMC - PubMed
    1. Usadel B, Obayashi T, Mutwil M, Giorgi FM, Bassel GW, Tanimoto M, Chow A, Steinhauser D, Persson S, Provart NJ. Co-expression tools for plant biology: opportunities for hypothesis generation and caveats. Plant Cell Environ. 2009;32:1633–1651. - PubMed
    1. Hirai MY, Sugiyama K, Sawada Y, Tohge T, Obayashi T, Suzuki A, Araki R, Sakurai N, Suzuki H, Aoki K, et al. Omics-based identification of Arabidopsis Myb transcription factors regulating aliphatic glucosinolate biosynthesis. Proc. Natl Acad. Sci. USA. 2007;104:6478–6483. - PMC - PubMed
    1. Persson S, Wei H, Milne J, Page GP, Somerville CR. Identification of genes required for cellulose synthesis by regression analysis of public microarray data sets. Proc. Natl Acad. Sci. USA. 2005;102:8633–8638. - PMC - PubMed

Publication types