. 2011 Jan 21;286(3):2320-30.
doi: 10.1074/jbc.M110.196022. Epub 2010 Nov 20.

The MARCKS protein plays a critical role in phosphatidylinositol 4,5-bisphosphate metabolism and directed cell movement in vascular endothelial cells

Affiliations

The MARCKS protein plays a critical role in phosphatidylinositol 4,5-bisphosphate metabolism and directed cell movement in vascular endothelial cells

Hermann Kalwa et al. J Biol Chem. .

Abstract

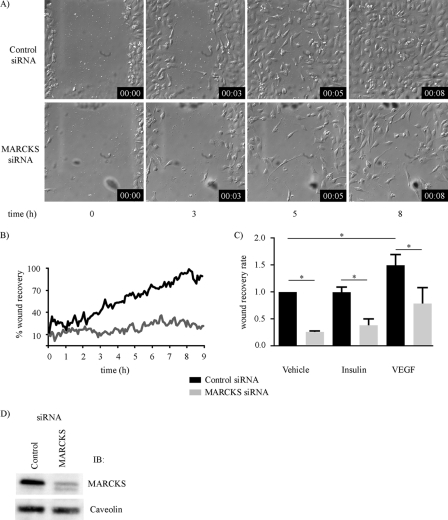
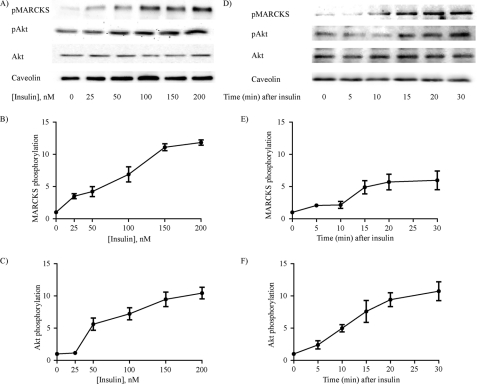
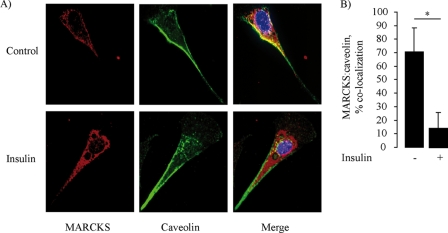
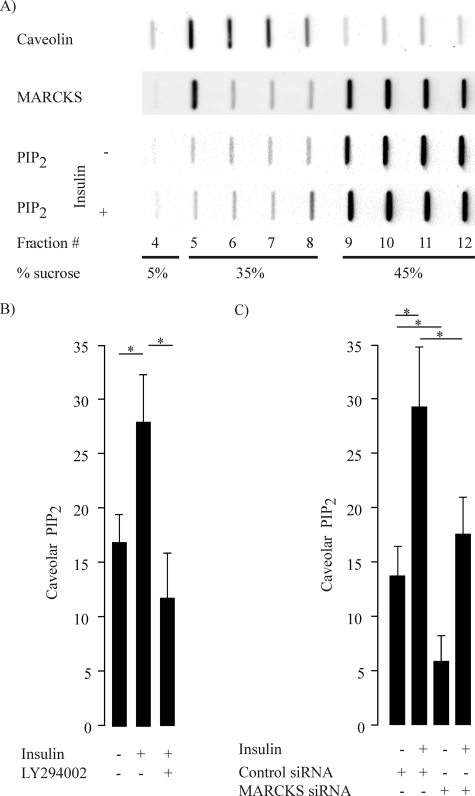
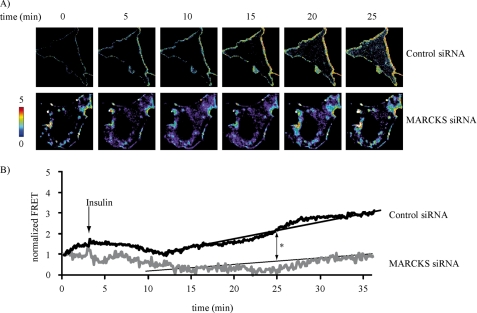
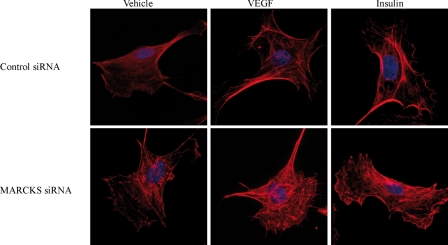
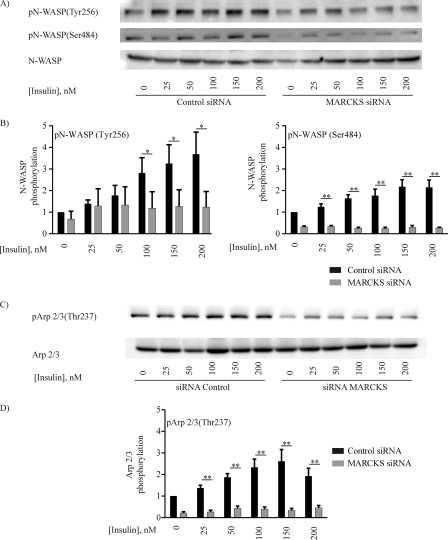
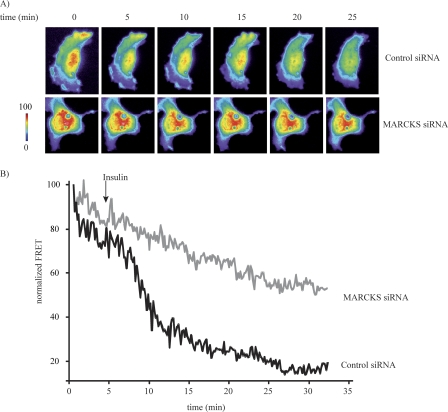
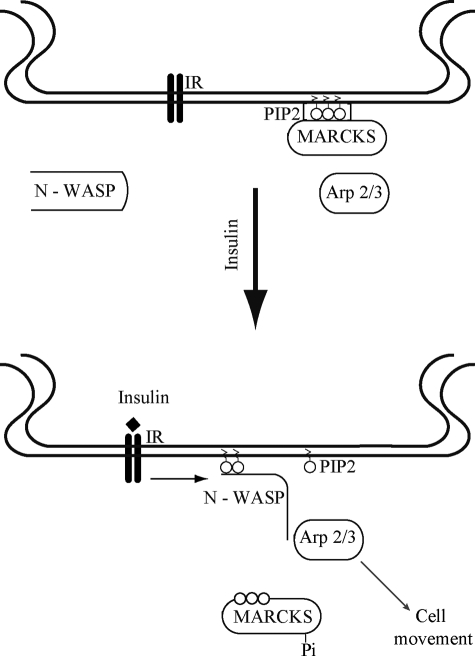
The MARCKS protein (myristoylated alanine-rich C kinase substrate) is an actin- and calmodulin-binding protein that is expressed in many mammalian tissues. The role of MARCKS in endothelial signaling responses is incompletely understood. We found that siRNA-mediated knockdown of MARCKS in cultured endothelial cells abrogated directed cell movement in a wound healing assay. We used biochemical and cell imaging approaches to explore the role of MARCKS in endothelial signal transduction pathways activated by insulin. Insulin treatment of vascular endothelial cells promoted the dose- and time-dependent phosphorylation of MARCKS. Cell imaging and hydrodynamic approaches revealed that MARCKS is targeted to plasmalemmal caveolae and undergoes subcellular translocation in response to insulin. Insulin treatment promoted an increase in levels of the signaling phospholipid phosphatidylinositol 4,5-bisphosphate (PIP(2)) in plasmalemmal caveolae. The insulin-stimulated increase in caveolar PIP(2) was blocked by siRNA-mediated knockdown of MARCKS, as determined using both biochemical assays and imaging studies using FRET-based PIP(2) biosensors. The critical role of PIP(2) in MARCKS responses was explored by examining the PIP(2)- and actin-binding proteins Arp2/3 and N-WASP. Insulin promoted the rapid and robust phosphorylation of both N-WASP and Arp2/3, but these phosphorylation responses were markedly attenuated by siRNA-mediated MARCKS knockdown. Moreover, MARCKS knockdown effectively abrogated N-WASP activation in response to insulin, as determined using a FRET-based N-WASP activity biosensor. Taken together, these studies show that MARCKS plays a key role in insulin-dependent endothelial signaling to PIP(2) and is a critical determinant of actin assembly and directed cell movement in the vascular endothelium.


Figures

FIGURE 1.
FIGURE 1.
Effects of siRNA-mediated MARCKS knockdown on endothelial cell wound healing. Shown are the results of a wound healing assay analyzed in cultured endothelial cells transfected 48 h previously with either control or MARCKS duplex siRNA constructs. A, selected time-lapse photomicrographs (magnification ×10) obtained at the indicated times after producing a linear wound in the endothelial monolayer; the borders of the wound at t = 0 are noted. Differential interference contrast images were recorded every minute for 8 h using live-cell imaging conditions in an Olympus DSU microscope; the experiment shown was repeated three times with equivalent results. B, pooled data from three independent experiments in which the percentage of the original wound that is occupied by cells is plotted as a function of time, and then quantitated using Image J software. The difference in the rate of wound recovery is highly significant between the control and MARCKS siRNA-transfected endothelial cells (p < 0.001, n = 3). C, the results of wound healing assays analyzed after transfection of endothelial cells with control or MARCKS siRNA. They were then studied following cell wounding in the presence of the vehicles, VEGF (20 ng/ml), and insulin (100 nm), as shown. The fractional repopulation of the wound by endothelial cells is shown on the ordinate, as in B. D, an immunoblot of endothelial cells transfected with control or MARCKS siRNA-targeting constructs, and probed with antibodies as shown.
FIGURE 2.
FIGURE 2.
Insulin-stimulated MARCKS phosphorylation in endothelial cells. Shown here are the results of dose response (A–C) and time course (D–F) experiments exploring insulin-mediated MARCKS phosphorylation responses in endothelial cells. Lysates prepared from insulin-treated endothelial cells were resolved by SDS-PAGE and analyzed in immunoblots probed with antibodies as shown against total or phosphorylated MARCKS (pMARCKS), or antibodies directed against total or phosphorylated Akt (pAkt). In the time course experiments, cells were treated with 100 nm insulin; in the dose response experiments, cells were analyzed 15 min after addition of insulin. A and D, representative immunoblots; B and C, and E and F present quantitative plots derived from pooled data; each point in the graphs represents the mean ± S.E. of four independent experiments that yielded similar results.
FIGURE 3.
FIGURE 3.
Insulin-stimulated translocation of MARCKS in cultured endothelial cells. Shown are representative photomicrographs of endothelial cells treated with insulin (100 nm) or vehicle, fixed, and then stained with antibodies directed against MARCKS or caveolin-1. Detection was carried out with secondary antibodies coupled to Alexa Fluor 488 or Alexa Fluor 568, respectively. Nuclei were stained with 4′,6-diamidino-2-phenylindole. A, representative images of the staining pattern obtained for MARCKS and caveolin antibodies, analyzed in two-dimensional projections of three-dimensional optical stacks that where obtained by white light confocal imaging (magnification ×60). The MARCKS staining pattern is shown in red; caveolin in green; and colocalization in yellow. B, statistical analyses obtained using the MetaMorph colocalization analysis module. Each bar represents the mean ± S.E. of five independent experiments that yielded similar results. *, p < 0.05.
FIGURE 4.
FIGURE 4.
Hydrodynamic analysis of MARCKS, caveolin-1, and PIP2 distribution in endothelial cells. A, the results of subcellular fractionation of endothelial cells analyzed in discontinuous sucrose gradients to resolve lipid rafts/caveolae (fractions 5–8) and nonlipid raft cellular constituents (fractions 9–12). Aliquots of each fraction were analyzed in slot blots that were probed with specific antibodies directed against MARCKS, caveolin-1, or PIP2, as shown. PIP2 distribution was also analyzed following insulin treatment of endothelial cells (100 nm for 15 min). B, quantitative analyses of PIP2 in the lipid raft/caveolar fraction following treatments of endothelial cells with insulin (100 nm for 15 min). PIP2 content was quantitated by densitometric analysis of slot blots probed with antibodies directed against phospholipid-specific PH domains, and the amount of PIP2 in the lipid raft fraction was normalized to the total amount of PIP2 in all fractions. The data are expressed as a percentage of the amount of PIP2 detected in the lipid raft fraction. The graph on the left shows quantitation of PIP2 in caveolar fractions following insulin treatment in the presence or absence of the PI3K inhibitor LY294002 (10 mm). The graph on the right shows the distribution of PIP2 in caveolar fractions in endothelial cells transfected with control siRNA or siRNA directed against MARCKS. *, p < 0.01 compared with control siRNA-transfected cells (n = 6).
FIGURE 5.
FIGURE 5.
FRET-based analysis of insulin-stimulated PIP2 accumulation following siRNA-mediated MARCKS knockdown. A, representative images of endothelial cells transfected with PIP2 biosensor plasmids plus either control or MARCKS siRNA constructs; the individual panels show the time lapse of FRET images obtained following treatment with insulin (100 nm) or vehicle at the indicated times. B, pooled quantitative data from six independent experiments. The data are expressed as change of FRET ratio over time, reflecting the abundance of PIP2 at the plasma membrane. *, p < 0.01 (n = 6), as compared with control treated cells.
FIGURE 6.
FIGURE 6.
Effects of siRNA-mediated MARCKS knockdown on the endothelial cell actin cytoskeleton. Shown are representative photomicrographs obtained in endothelial cells that were transfected with control or MARCKS siRNA, treated for 30 min with vehicle, VEGF (20 ng/ml), or insulin (100 nm) as shown, and then fixed and stained with phalloidin/Alexa Fluor 568 using the manufacturer's protocols. Fluorescent micrographic images were analyzed at λ = 573 nm using an Olympus DSU confocal imaging system (magnification ×100).
FIGURE 7.
FIGURE 7.
Insulin-promoted phosphorylation of N-WASP and Arp2/3 in cultured endothelial cells. Show are immunoblots from an insulin dose-response experiment probed with antibodies directed against the PIP2- and actin-binding proteins N-WASP (A and B) and Arp2/3 (C and D). Lysates prepared from insulin-treated BAEC were resolved by SDS-PAGE and analyzed in immunoblots probed with antibodies for total or phospho-N-WASP (phosphorylated residues pTyr-256 (pN-WASP(Tyr256) and pSer-484 (pN-WASP(Ser484), as shown) or total or phospho-Arp2/3 (pTyr-265). A and C, representative immunoblots. B and D, quantitative plots derived from pooled data. Each bar in the graphs represents the mean ± S.E. of four independent experiments that yielded similar results. *, p < 0.05; **, p < 0.01.
FIGURE 8.
FIGURE 8.
Analysis of N-WASP activation using a FRET based N-WASP biosensor after siRNA-mediated MARCKS knockdown. A, representative images of endothelial cells transfected with the N-WASP FRET biosensor plasmid plus either control or MARCKS siRNA constructs. Following addition of insulin, cells were monitored for the appearance of YFP emission after CFP excitation; the individual panels show the time lapse of FRET images obtained following treatment with insulin (100 nm) or vehicle at the indicated times. Parameter correction was carried out with the MetaMorph FRET module. B, pooled quantitative data from six independent experiments. The data are expressed as the change of FRET ratio over time, which reflects the degree of N-WASP activation. *, p < 0.01 (n = 6), as compared with control siRNA-transfected cells.
FIGURE 9.
FIGURE 9.
Model for the role of MARCKS in insulin-modulated PIP2 mobilization. Shown is a model that integrates the findings in this study that have explored the pathways of insulin-mediated PIP2 mobilization. In resting endothelial cells (upper panel), MARCKS sequesters PIP2 in caveolae, and N-WASP and Arp2/3 are quiescent and not interacting with one another. Insulin receptor activation (lower panel) leads to the mobilization of PIP2 from MARCKS, accompanied by MARCKS phosphorylation and translocation from caveolae to intracellular sites. The mobilized PIP2 binds to and activates N-WASP and Arp2/3, leading to alterations in the actin cytoskeleton that are critical determinants of directed endothelial cell movement. See text for further discussion.

Similar articles

Cited by

References

    1. Larsson C. (2006) Cell. Signal. 18, 276–284 - PubMed
    1. Sheetz M. P., Sable J. E., Döbereiner H. G. (2006) Annu. Rev. Biophys. Biomol. Struct. 35, 417–434 - PubMed
    1. Stumpo D. J., Bock C. B., Tuttle J. S., Blackshear P. J. (1995) Proc. Natl. Acad. Sci. U.S.A. 92, 944–948 - PMC - PubMed
    1. Fujita A., Cheng J., Tauchi-Sato K., Takenawa T., Fujimoto T. (2009) Proc. Natl. Acad. Sci. U.S.A. 106, 9256–9261 - PMC - PubMed
    1. Anderson R. G., Jacobson K. (2002) Science 296, 1821–1825 - PubMed

Publication types

MeSH terms

Substances

LinkOut - more resources