

Concentration-dependent exchange accelerates turnover of proteins bound to double-stranded DNA
- PMID: 21097894
- PMCID: PMC3064784
- DOI: 10.1093/nar/gkq1140
Concentration-dependent exchange accelerates turnover of proteins bound to double-stranded DNA
Abstract
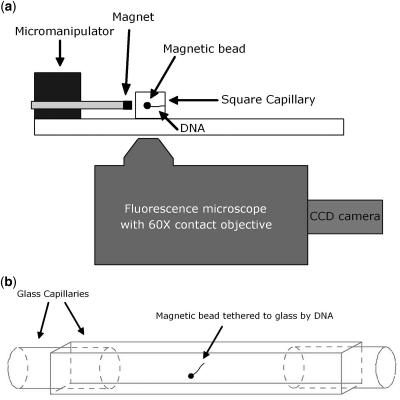
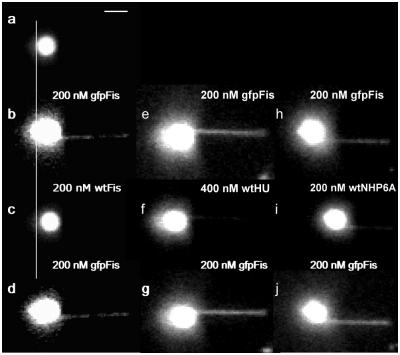
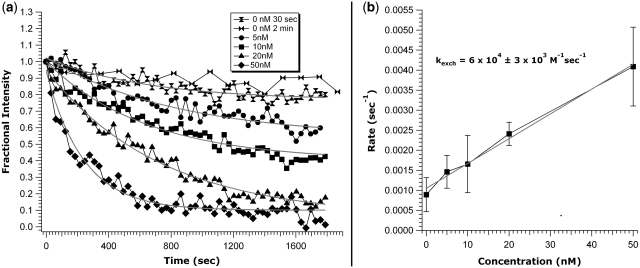
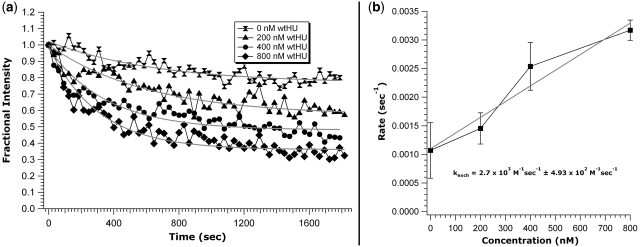
The multistep kinetics through which DNA-binding proteins bind their targets are heavily studied, but relatively little attention has been paid to proteins leaving the double helix. Using single-DNA stretching and fluorescence detection, we find that sequence-neutral DNA-binding proteins Fis, HU and NHP6A readily exchange with themselves and with each other. In experiments focused on the Escherichia coli nucleoid-associated protein Fis, only a small fraction of protein bound to DNA spontaneously dissociates into protein-free solution. However, if Fis is present in solution, we find that a concentration-dependent exchange reaction occurs which turns over the bound protein, with a rate of k(exch) = 6 × 10(4) M(-1)s(-1). The bacterial DNA-binding protein HU and the yeast HMGB protein NHP6A display the same phenomenon of protein in solution accelerating dissociation of previously bound labeled proteins as exchange occurs. Thus, solvated proteins can play a key role in facilitating removal and renewal of proteins bound to the double helix, an effect that likely plays a major role in promoting the turnover of proteins bound to DNA in vivo and, therefore, in controlling the dynamics of gene regulation.
Figures
Similar articles
-
DNA-Segment-Facilitated Dissociation of Fis and NHP6A from DNA Detected via Single-Molecule Mechanical Response.J Mol Biol. 2015 Sep 25;427(19):3123-36. doi: 10.1016/j.jmb.2015.07.015. Epub 2015 Jul 26. J Mol Biol. 2015. PMID: 26220077 Free PMC article.
-
Facilitated dissociation of transcription factors from single DNA binding sites.Proc Natl Acad Sci U S A. 2017 Apr 18;114(16):E3251-E3257. doi: 10.1073/pnas.1701884114. Epub 2017 Mar 31. Proc Natl Acad Sci U S A. 2017. PMID: 28364020 Free PMC article.
-
Facilitated Dissociation of a Nucleoid Protein from the Bacterial Chromosome.J Bacteriol. 2016 May 27;198(12):1735-42. doi: 10.1128/JB.00225-16. Print 2016 Jun 15. J Bacteriol. 2016. PMID: 27044624 Free PMC article.
-
Effects of nucleoid-associated proteins on bacterial chromosome structure and gene expression.Curr Opin Microbiol. 2010 Dec;13(6):773-80. doi: 10.1016/j.mib.2010.09.013. Epub 2010 Oct 13. Curr Opin Microbiol. 2010. PMID: 20951079 Review.
-
Facilitated Unbinding via Multivalency-Enabled Ternary Complexes: New Paradigm for Protein-DNA Interactions.Acc Chem Res. 2018 Apr 17;51(4):860-868. doi: 10.1021/acs.accounts.7b00541. Epub 2018 Jan 25. Acc Chem Res. 2018. PMID: 29368512 Free PMC article. Review.
Cited by
-
Simple biochemical features underlie transcriptional activation domain diversity and dynamic, fuzzy binding to Mediator.Elife. 2021 Apr 27;10:e68068. doi: 10.7554/eLife.68068. Elife. 2021. PMID: 33904398 Free PMC article.
-
Optical Methods to Study Protein-DNA Interactions in Vitro and in Living Cells at the Single-Molecule Level.Int J Mol Sci. 2013 Feb 18;14(2):3961-92. doi: 10.3390/ijms14023961. Int J Mol Sci. 2013. PMID: 23429188 Free PMC article.
-
Single-molecule FRET analysis of DNA binding and bending by yeast HMGB protein Nhp6A.Nucleic Acids Res. 2013 Jan;41(2):1372-81. doi: 10.1093/nar/gks1208. Epub 2012 Dec 5. Nucleic Acids Res. 2013. PMID: 23221634 Free PMC article.
-
Subunit composition of the mammalian serine-palmitoyltransferase defines the spectrum of straight and methyl-branched long-chain bases.Proc Natl Acad Sci U S A. 2020 Jul 7;117(27):15591-15598. doi: 10.1073/pnas.2002391117. Epub 2020 Jun 23. Proc Natl Acad Sci U S A. 2020. PMID: 32576697 Free PMC article.
-
Molecular stripping, targets and decoys as modulators of oscillations in the NF-κB/IκBα/DNA genetic network.J R Soc Interface. 2016 Sep;13(122):20160606. doi: 10.1098/rsif.2016.0606. Epub 2016 Sep 28. J R Soc Interface. 2016. PMID: 27683001 Free PMC article.
References
-
- Hu T, Shklovskii BI. How a protein searches for its specific site on DNA: the role of intersegment transfer. Phys. Rev. E: Stat., Nonlinear, Soft Matter Phys. 2007;76:051909. - PubMed
-
- von Hippel PH, Berg OG. Facilitated target location in biological systems. J. Biol. Chem. 1989;264:675–678. - PubMed
Publication types
MeSH terms
Substances
Grants and funding
LinkOut - more resources
Full Text Sources
Other Literature Sources
Molecular Biology Databases
Research Materials
Miscellaneous
