. 2011 Jan;66(1):15-28.
doi: 10.1093/jac/dkq387. Epub 2010 Nov 21.

Phenotypic and genotypic characterization of influenza virus mutants selected with the sialidase fusion protein DAS181

Affiliations

Phenotypic and genotypic characterization of influenza virus mutants selected with the sialidase fusion protein DAS181

Gallen B Triana-Baltzer et al. J Antimicrob Chemother. 2011 Jan.

Abstract

Background: influenza viruses (IFVs) frequently achieve resistance to antiviral drugs, necessitating the development of compounds with novel mechanisms of action. DAS181 (Fludase), a sialidase fusion protein, may have a reduced potential for generating drug resistance due to its novel host-targeting mechanism of action.

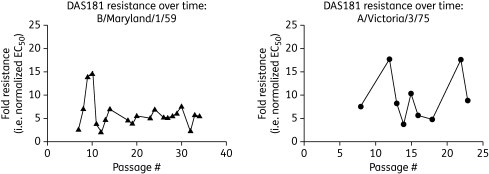
Methods: IFV strains B/Maryland/1/59 and A/Victoria/3/75 (H3N2) were subjected to >30 passages under increasing selective pressure with DAS181. The DAS181-selected IFV isolates were characterized in vitro and in mice.

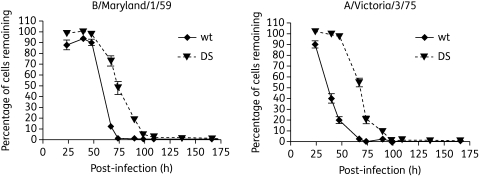
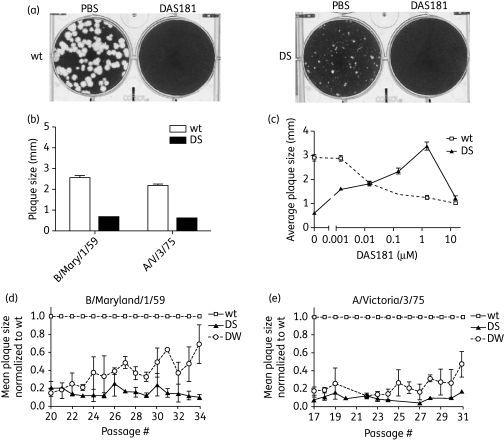
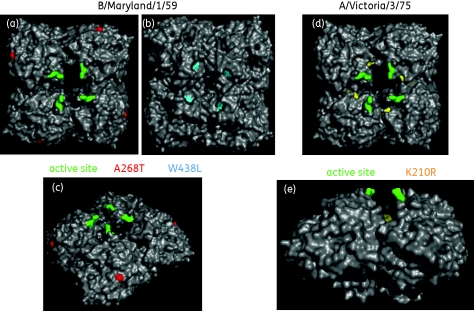
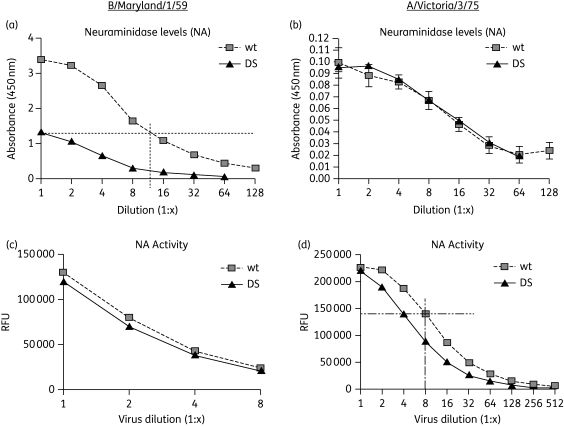
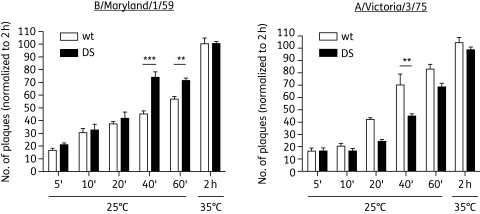
Results: despite extensive passaging, DAS181-selected viruses exhibited a very low level of resistance to DAS181, which ranged between 3- and 18-fold increase in EC(50). DAS181-selected viruses displayed an attenuated phenotype in vitro, as exhibited by slower growth, smaller plaque size and increased particle to pfu ratios relative to wild-type virus. Further, the DAS181 resistance phenotype was unstable and was substantially reversed over time upon DAS181 withdrawal. In mice, the DAS181-selected viruses exhibited no greater virulence than their wild-type counterparts. Genotypic and phenotypic analysis of DAS181-selected viruses revealed mutations in the haemagglutinin (HA) and neuraminidase (NA) molecules and also changes in HA and NA function.

Conclusions: results indicate that resistance to DAS181 is minimal and unstable. The DAS181-selected IFV isolates exhibit reduced fitness in vitro, likely due to altered HA and NA functions.


Figures

Figure 1.
Figure 1.
DAS181 resistance level throughout passaging. wt and DS isolates from selected passages of IFV B/Maryland/1/59 (left-hand panel) were analysed in parallel for sensitivity to DAS181. Similarly, wt and DS isolates from selected passages of IFV A/Victoria/3/75 (right-hand panel) were analysed in parallel for sensitivity to DAS181. Fold resistances were quantified using derived EC50 values (DS EC50/wt EC50) at each passage.
Figure 2.
Figure 2.
DS IFV growth dynamics in vitro. Confluent monolayers of MDCK were infected with wt and DS IFVs at equivalent infectious doses. At selected timepoints the wells were fixed with Crystal Violet to determine the amount of live cells. The percentage of cells remaining was calculated by comparing with the uninfected control. Values represent means ± SD of triplicate samples.
Figure 3.
Figure 3.
Phenotypic characterization of DS IFV: plaque size. Confluent monolayers of MDCK cells were infected with wt and DS IFVs and overlaid with 1 : 1 agar/medium to allow plaque formation. Plaque sizes of wt (left-hand panel) and DS passage 22 IFV B/Maryland (right-hand panel) grown with PBS or DAS181 (a). Plaque sizes of wt (white bars) and DS (black bars) IFV B/Maryland/1/59 (passage 17) and A/Victoria/3/75 (passage 14) grown without drug (b). Plaque sizes of wt (broken line) or DS (continuous line) A/Victoria/3/75 virus (passage 13) in the presence of the indicated concentrations of DAS181 (c). Plaque sizes of wt, DS and DW viruses (normalized at each passage to wt) shown to indicate the return to near-wt plaque size in DW viruses after DAS181 removal (d and e). Values represent mean ± SD size of ≥24 plaques per condition.
Figure 4.
Figure 4.
Relative viral fitness in vivo. BALB/C mice were inoculated intranasally with wt and DS B/Maryland/1/59 (inocula shown in M-gene copy number and pfu). Survival (top) and body weight (middle) were tracked daily for 15 days post-infection; viral titre in lung homogenate was determined at 3 days post-infection for one dose group (bottom, 8.4–8.5 e8 copies). wt at 1.7 e8 copies had 100% survival; all DS groups had 100% survival. Animals with greatest body weight loss often did not survive infection, thus body weight recovery curves are in some cases escalated by the more modest weight loss of survivors. Values represent means ± SEM of eight mice per group in survival and body weight analyses, and three mice per group in viral titre analyses. ***P<0.001, significantly different from identical challenge dose of wt infection as determined by analysis of variance with the Bonferroni post-test.
Figure 5.
Figure 5.
Location of HA mutations identified in DS and DW IFV. The amino acid positions for the stable HA mutations (listed in Tables S1 and S2) were located on the published crystal structure of an IFV B or IFV A H3 HA homotrimer., In the IFV B/Maryland/1/59 model amino acid 136 is shown in yellow, amino acid 137 is shown in green and amino acid 155 is shown in red. In the IFV A/Victoria/3/75 model amino acid 186 is shown in blue and amino acid 248 is shown in pink; the T10I mutation in A/Victoria/3/75 wt HA lies in the transmembrane region and is not modelled. The top panels show a top-down view of the HA homotrimer while the bottom panels show a side view. The approximate site of sialic acid binding is indicated with arrows.,
Figure 6.
Figure 6.
Location of NA mutations identified in DS and DW IFV. The amino acid positions for the NA mutations (listed in Tables S1 and S2) were located on the published crystal structure of an IFV A N9 homotetramer. In the IFV B/Maryland/1/59 model (a–c) amino acid 268 is shown in red and amino acid 438 is shown in blue; amino acid 38 lies in the transmembrane region and is not modelled. In the IFV A/Victoria/3/75 model (d and e) amino acid 210 is shown in yellow. (a and d) Top-down view. (b) Bottom-up view. (c and e) Side view. The known active site is indicated with green residues.,
Figure 7.
Figure 7.
Relative NA protein and activity levels in DS IFV. Serial dilutions of wt and DS IFV B/Maryland/1/59 (a) or A/Victoria/3/75 (b) (pre-equilibrated by NP protein level) were probed for HA, NA or NP protein by ELISA with specific antibodies to each viral antigen. Only NA protein levels are shown. The horizontal and vertical broken lines in (a) indicate the relative amount of NA protein in DS IFV B/Maryland/1/59 (∼10% of wt). Serial dilutions of wt and DS IFV B/Maryland/1/59 (c) or A/Victoria/3/75 (d) (pre-equilibrated by NA protein level) were tested for NA activity level and RFU readout was plotted against viral dilution. The horizontal and vertical broken lines in (d) indicate the relative amount of NA activity in DS IFV A/Victoria/3/75 (∼50% of wt). Error bars indicate means ± SD of duplicate samples.
Figure 8.
Figure 8.
Relative HA affinity of DS IFV: binding dynamics on MDCK cells. wt and DS IFV B/Maryland/1/59 (left-hand panel) and A/Victoria/3/75 (right-hand panel) were applied to MDCK cells at equal infection levels for the indicated incubation times and temperatures before washing away unbound virus and overlaying with agar. Three days later the number of plaques was counted for each binding condition and normalized to maximal binding. For B/Maryland/1/59, the DS virus bound significantly faster than wt. For A/Victoria/3/75, the DS virus bound significantly slower than wt. Values represent means ± SEM of triplicate samples, and the unpaired t-test was used to calculate statistical significance; **, *** = P < 0.01, P < 0.001, respectively, using ANOVA/Bonferroni post-test.
Figure 9.
Figure 9.
Relative HA specificity of DS IFV B/Maryland/1/59. Binding of IFV B/Maryland/1/59 to the CFG v3.2 glycan array was detected with specific antibodies to viral antigen; readout is described arbitrarily as RFU. wt and DS viruses were applied at approximately equivalent total fluorescence units (across the entire array) and the intensity of binding to each of the 406 glycans on the array was graphed. Note a relative increase in the number of glycans bound by the DS virus. Values represent means ± SEM of quadruplicate samples. Detailed information on the top 20 bound glycans in each graph is shown in Table S3.

Similar articles

Cited by

References

    1. WHO. Seasonal Influenza Factsheet. http://www.who.int/mediacentre/factsheets/fs211/en/index.html , 12 July 2010, date last accessed.
    1. Dharan NJ, Gubareva LV, Meyer JJ, et al. Infections with oseltamivir-resistant influenza A(H1N1) virus in the United States. JAMA. 2009;301:1034–41. doi:10.1001/jama.2009.294. - DOI - PubMed
    1. Hatakeyama S, Sugaya N, Ito M, et al. Emergence of influenza B viruses with reduced sensitivity to neuraminidase inhibitors. JAMA. 2007;297:1435–42. doi:10.1001/jama.297.13.1435. - DOI - PubMed
    1. Hayden FG, Hay AJ. Emergence and transmission of influenza A viruses resistant to amantadine and rimantadine. Curr Top Microbiol Immunol. 1992;176:119–30. - PubMed
    1. Moscona A. Oseltamivir resistance—disabling our influenza defenses. N Engl J Med. 2005;353:2633–6. doi:10.1056/NEJMp058291. - DOI - PubMed

Publication types

MeSH terms