. 2010 Dec 17;330(6011):1689-92.
doi: 10.1126/science.1196154. Epub 2010 Nov 18.

Glucose and weight control in mice with a designed ghrelin O-acyltransferase inhibitor

Affiliations

Glucose and weight control in mice with a designed ghrelin O-acyltransferase inhibitor

Brad P Barnett et al. Science. .

Abstract

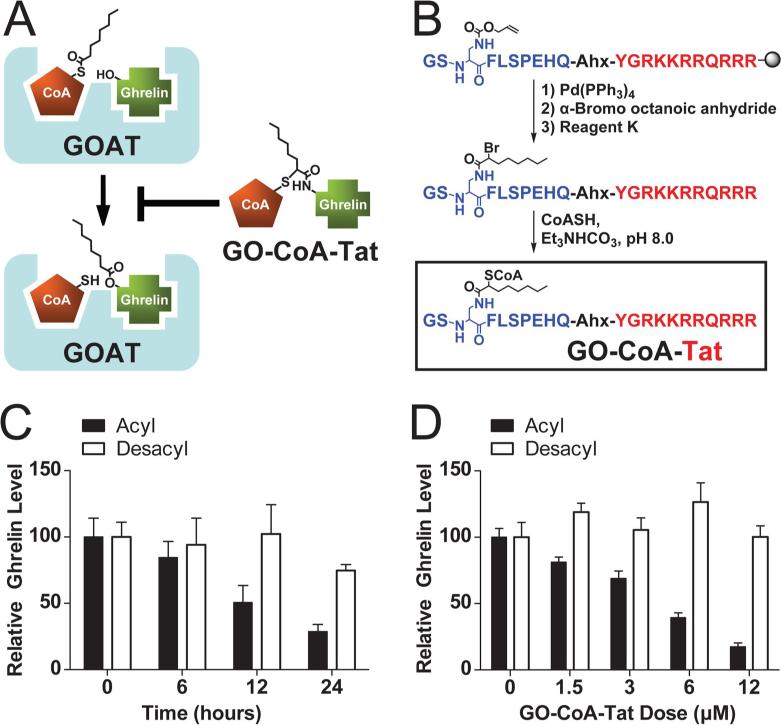
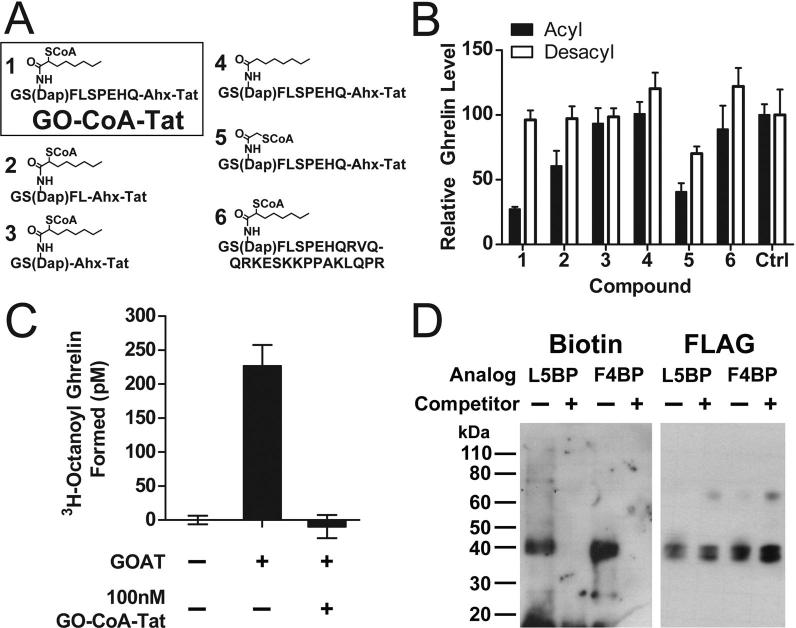
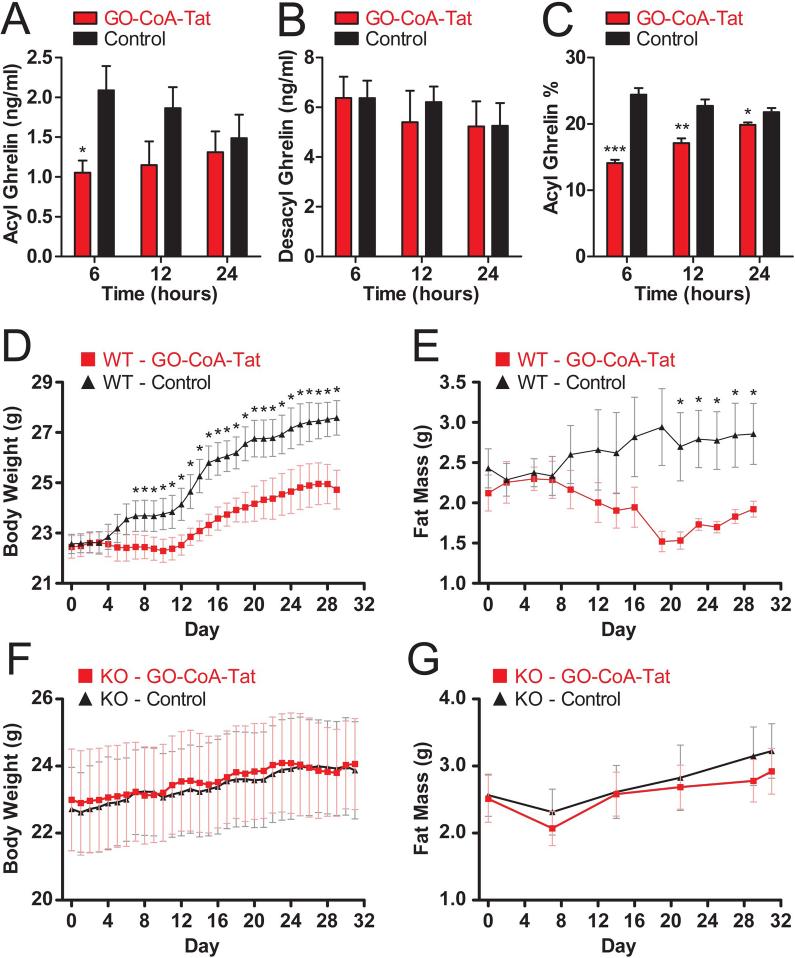
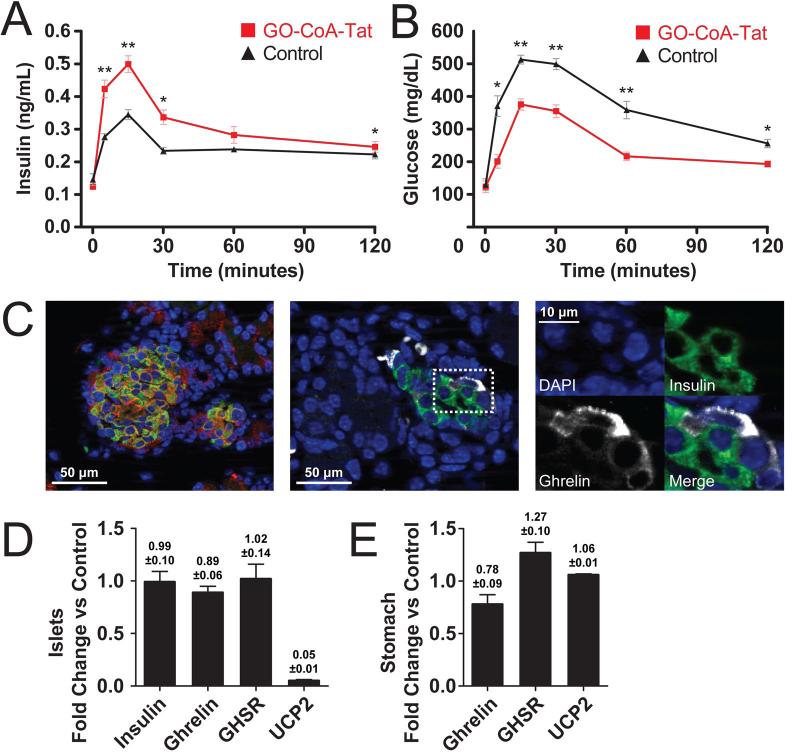
Ghrelin is a gastric peptide hormone that stimulates weight gain in vertebrates. The biological activities of ghrelin require octanoylation of the peptide on Ser(3), an unusual posttranslational modification that is catalyzed by the enzyme ghrelin O-acyltransferase (GOAT). Here, we describe the design, synthesis, and characterization of GO-CoA-Tat, a peptide-based bisubstrate analog that antagonizes GOAT. GO-CoA-Tat potently inhibits GOAT in vitro, in cultured cells, and in mice. Intraperitoneal administration of GO-CoA-Tat improves glucose tolerance and reduces weight gain in wild-type mice but not in ghrelin-deficient mice, supporting the concept that its beneficial metabolic effects are due specifically to GOAT inhibition. In addition to serving as a research tool for mapping ghrelin actions, GO-CoA-Tat may help pave the way for clinical targeting of GOAT in metabolic diseases.


Figures

Fig. 1
Fig. 1
GO-CoA-Tat is a bisubstrate inhibitor that inhibits GOAT, lowering acyl ghrelin levels. (A) Mechanism-based design strategy. Lipid-enzyme interaction, not shown, may also be important. (B) Structure of GO-CoA-Tat and synthetic scheme for bisubstrate inhibitors that consist of three components: coenzyme A, octanoylated ghrelin peptide and a Tat peptide; Ahx-aminohexanoate. (C) Temporal inhibition of acyl but not desacyl ghrelin production by 6 μM GO-CoA-Tat in GOAT/preproghrelin-transfected HeLa cells. (D) Dose-response reduction of acyl but not desacyl ghrelin levels by GO-CoA-Tat in GOAT/preproghrelin-transfected HeLa cells after 24 h incubation.
Fig. 2
Fig. 2
GO-CoA-Tat targets GOAT directly in vitro and in a structure specific manner. (A) Structure of GO-CoA-Tat analogs (–6). (B) Acyl and desacyl ghrelin levels after treatment with 6 μM GO-CoA-Tat (1) and analogs (–6) from GOAT/preproghrelin-transfected HeLa cells after 24 h. (C) In vitro acyltransferase inhibition assay (5 min reaction) with microsomal recombinant GOAT. (D) UV crosslinking of solubilized GOAT by biotin-tagged, benzophenylalanine analogs of GO-CoA-Tat (L5BP, F4BP) (5 μM). Competitor is GO-CoA-Tat at 100 μM. Immunoblots of cross-linked GOAT were visualized with streptavidin, loading was checked with anti-FLAG.
Fig. 3
Fig. 3
Effects of GO-CoA-Tat on blood ghrelin and body weight in mice. (A) Serum acyl ghrelin levels in WT C57BL6 mice on an MCT diet treated intraperitoneally with 11 μmol/kg GO-CoA-Tat vs. D4-Tat control (n = 5) after 6, 12, and 24 h. (*P < 0.05, **P < 0.01, ***P < 0.001, std. errors shown). The changes in acyl ghrelin over 24 h in control animals are neither statistically significant (P > 0.2), nor reproducible in other experiments. (B) Serum desacyl ghrelin levels for experiment in Fig. 3A. (C) Percent acyl ghrelin for experiment in Fig. 3A. (D) Body weights in wt C57BL6 mice on an MCT diet treated with 11 μmmol/kg GO-CoA-Tat (red, n = 5) or vehicle (black, n = 6) for 1 mo (*P < 0.05; conventional ** and *** omitted for clarity, standard errors shown). (E) Fat mass in wt mice measured by QMR for experiment in 3D. (F) Body weights in ghrelin knockout C57BL6 mice on an MCT diet treated with 11 μmol/kg GO-CoA-Tat (red, n = 5) or vehicle (black, n = 5) for 1 mo (standard errors shown). The larger error bars compared to data in Fig. 3D likely represent the broader distribution of starting weights. Also note that the scales differ in the two panels, contributing to the larger error bars seen here. (G) Fat mass in ghrelin knockout mice measured by QMR for experiment in Fig. 3F.
Fig. 4
Fig. 4
GO-CoA-Tat increases insulin, decreases glucose levels, and down-regulates islet cell UCP2 mRNA. (A) C57BL6 wt mice raised on normal mouse chow and treated with 8 μmol/kg GO-CoA-Tat (n = 4) experienced a statistically significant increase in insulin secretion and (B) a statistically significant decrease in blood glucose as compared to control mice (treated with D4-Tat (n = 4)) when compound was administered 24 h prior to IP glucose challenge (2.5g/kg) (*P < 0.05, **P < 0.01, std. errors shown). (C) Immunohistochemical staining of mouse islets. Left panel – insulin (green) ghrelin receptor (GHSR) (red) and cell nuclei stained with DAPI (blue). Middle panel – staining of islet for ghrelin (white) and insulin (green) demonstrates dual staining and ghrelin positive and insulin negative cells. Right panel – closeup of unmerged images in boxed area of middle panel. (D) QRT-PCR of islets and (E) gastric fundus isolated from mice treated with inhibitor 24 h prior to isolation and mRNA expression relative to control (n = 3).

Comment in

Similar articles

Cited by

References

    1. Rosenbaum M, et al. J. Clin. Endocrinol. Metab. 1996;81:3424. - PubMed
    1. Kojima M, et al. Nature. 1999;402:656. - PubMed
    1. Tschöp M, Smiley DL, Heiman ML. Nature. 2000;407:908. - PubMed
    1. Wren AM, et al. Diabetes. 2001;50:2540. - PubMed
    1. Zigman JM, et al. J. Clin. Invest. 2005;115:3564. - PMC - PubMed

Publication types

MeSH terms