. 2011 Jan 21;286(3):1819-27.
doi: 10.1074/jbc.M110.187369. Epub 2010 Nov 22.

Chymotrypsin C is a co-activator of human pancreatic procarboxypeptidases A1 and A2

Affiliations

Chymotrypsin C is a co-activator of human pancreatic procarboxypeptidases A1 and A2

Richárd Szmola et al. J Biol Chem. .

Abstract

Human digestive carboxypeptidases CPA1, CPA2, and CPB1 are secreted by the pancreas as inactive proenzymes containing a 94-96-amino acid-long propeptide. Activation of procarboxypeptidases is initiated by proteolytic cleavage at the C-terminal end of the propeptide by trypsin. Here, we demonstrate that subsequent cleavage of the propeptide by chymotrypsin C (CTRC) induces a nearly 10-fold increase in the activity of trypsin-activated CPA1 and CPA2, whereas CPB1 activity is unaffected. Other human pancreatic proteases such as chymotrypsin B1, chymotrypsin B2, chymotrypsin-like enzyme-1, elastase 2A, elastase 3A, or elastase 3B are inactive or markedly less effective at promoting procarboxypeptidase activation. On the basis of these observations, we propose that CTRC is a physiological co-activator of proCPA1 and proCPA2. Furthermore, the results confirm and extend the notion that CTRC is a key regulator of digestive zymogen activation.


Figures
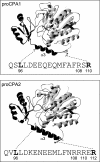
FIGURE 1.
FIGURE 1.
Ribbon diagram of porcine proCPA1 (Protein Data Bank code 1PCA) and human proCPA2 (Protein Data Bank code 1AYE). The propeptides are highlighted in black. The amino acid sequences of the α3 helices and the flanking tryptic activation sites in human proCPA1 and proCPA2 are indicated. The side chains for Leu96 (proCPA1 and proCPA2), Arg110 (proCPA1), and Arg112 (proCPA2) are shown. For clarity, the N-terminal amino acid residues have been removed, and the structures start with Gln24. The image was rendered using DeepView/Swiss-PdbViewer (version 3.7).
FIGURE 2.
FIGURE 2.
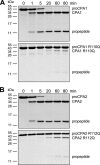
Activation of proCPA1 (A), proCPA2 (B), the R110Q proCPA1 mutant (A), and the R112Q proCPA2 mutant (B) by trypsin. Carboxypeptidase zymogens were incubated at 2 μm concentration with 100 nm human cationic trypsin at 37 °C in 20 mm Tris-HCl (pH 8.0) and 50 mm NaCl (final concentrations) in 100 μl final volume. At the indicated times, samples were precipitated with 10% trichloroacetic acid (final concentration) and analyzed by 15% SDS-PAGE and Coomassie blue staining. PageRuler prestained protein ladder was used to provide molecular mass markers (Fermentas, Glen Burnie, Maryland).
FIGURE 3.
FIGURE 3.
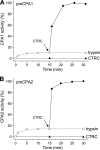
Activation of proCPA1 (A) and proCPA2 (B) by trypsin and CTRC. Carboxypeptidase zymogens were incubated at 2 μm concentration with 100 nm human cationic trypsin (open circles), 50 nm CTRC (solid triangles) or 50 nm CTRC added after 15 min preincubation with 100 nm trypsin (solid circles). Incubations were performed at 37 °C in 20 mm Tris-HCl (pH 8.0), 50 mm NaCl, and 0.05% Tween 20 (final concentrations) in 100 μl final volume. At the indicated times, carboxypeptidase activity was measured as described under “Experimental Procedures.” The 100% activity levels corresponded to 450 nm·s−1 (CPA1) and 340 nm·s−1 (CPA2) substrate cleavage rates.
FIGURE 4.
FIGURE 4.
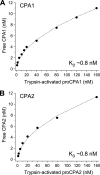
Concentration dependence of carboxypeptidase activity of proCPA1 (A) and proCPA2 (B) activated with trypsin. Carboxypeptidase zymogens were incubated at 2 μm concentration with 100 nm human cationic trypsin at 37 °C in 0.1 m Tris-HCl (pH 8.0), 50 mm NaCl, 1 mm CaCl2, and 0.05% Tween 20 (final concentrations) in 100 μl final volume. After 30 min of incubation, activated proenzymes were diluted to the indicated concentrations with assay buffer (0.1 m Tris-HCl (pH 8.0), 1 mm CaCl2, 0.05% Tween 20) and incubated for 10 min at 22 °C. Carboxypeptidase activity was then measured by adding 10 μl of N-[4-methoxyphenylazoformyl]-l-phenylalanine substrate to 60 μm final concentration, as described under “Experimental Procedures.” Carboxypeptidase activities were converted to free CPA1/CPA2 concentrations by dividing the activity values with the slope of the linear concentration-activity plots of trypsin and CTRC activated CPA1/CPA2 shown in supplemental Fig. S1. Data points were fitted to the equation y = (−K + sqrt(K 2 + 4Kx))/2, where K is the equilibrium dissociation constant. This equation is the positive solution to the K = y2/xy quadratic equation, which expresses the law of mass action applied to the dissociation of carboxypeptidase and its propeptide. The variable x corresponds to the total concentration of trypsin-activated proCPA1/proCPA2 present in the reaction, and y is the concentration of free CPA1/CPA2 in equilibrium. The concentration of the inhibited CPA1/CPA2 complex in equilibrium is described by xy.
FIGURE 5.
FIGURE 5.
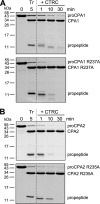
Activation of proCPA1 (A), proCPA2 (B), the R237A proCPA1 mutant (A), and the R235A proCPA2 mutant (B) by trypsin (Tr) and CTRC. Procarboxypeptidases were incubated at 2 μm concentration with 100 nm human cationic trypsin at 37 °C in 20 mm Tris-HCl (pH 8.0), 50 mm NaCl (final concentrations) in 100 μl final volume. After 5 min, 50 nm CTRC (final concentration) was added to the incubation reactions. At the indicated times, samples were precipitated with 10% trichloroacetic acid (final concentration) and analyzed by 15% SDS-PAGE and Coomassie Blue staining. PageRuler prestained protein ladder was used to provide molecular mass markers (Fermentas).
FIGURE 6.
FIGURE 6.
Activation of the L96I,L97I proCPA1 (A) and L96I,L97I proCPA2 (B) mutants by trypsin and CTRC. Procarboxypeptidase mutants and wild-type control were incubated at 2 μm concentration with 100 nm human cationic trypsin for 15 min followed by 50 nm CTRC (final concentrations). Incubations were performed at 37 °C in 20 mm Tris-HCl (pH 8.0), 50 mm NaCl and 0.05% Tween 20 (final concentrations) in 100 μl final volume. At the indicated times, carboxypeptidase activity was measured as described under “Experimental Procedures.” The 100% activity levels corresponded to 450 nm·s−1 (CPA1) and 340 nm·s−1 (CPA2) substrate cleavage rates.
FIGURE 7.
FIGURE 7.
Activation of proCPA1 (A) and proCPA2 (B) by trypsin and human pancreatic proteases. Carboxypeptidase zymogens were incubated at 2 μm concentration with 100 nm human cationic trypsin for 15 min followed by 50 nm of the indicated proteases (final concentrations). Incubations were performed at 37 °C in 20 mm Tris-HCl (pH 8.0), 50 mm NaCl, and 0.05% Tween 20 (final concentrations) in 100 μl final volume. At given times, carboxypeptidase activity was measured as described under “Experimental Procedures.” The 100% activity levels corresponded to 450 nm·s−1 (CPA1) and 340 nm·s−1 (CPA2) substrate cleavage rates.
FIGURE 8.
FIGURE 8.
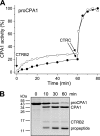
Activation of proCPA1 by CTRB2. A, procarboxypeptidase A1 was incubated at 2 μm concentration with 100 nm (solid symbols) or 200 nm (open symbols) CTRB2 for 60 min followed by 50 nm CTRC (final concentrations). Incubations were performed at 37 °C in 20 mm Tris-HCl (pH 8.0), 50 mm NaCl, and 0.05% Tween 20 (final concentrations) in 100 μl final volume. Reactions also contained human SPINK1 at 70 nm concentration to inhibit any unforeseen trypsin contamination. At given times, carboxypeptidase activity was measured as described under “Experimental Procedures.” The 100% activity level corresponded to 450 nm·s−1 substrate cleavage rate. B, alternatively, reactions were precipitated with 10% trichloroacetic acid (final concentration) and analyzed by 15% SDS-PAGE and Coomassie Blue staining. The experiment shown was performed with 100 nm CTRB2 concentration. Note that CTRB2 is physiologically autolyzed at the Tyr164–Asn165 peptide bond generating 14-kDa and 10.4-kDa fragments on reducing gels. The larger fragment is clearly visible on the gel, whereas the smaller fragment can be observed as a faint band above the CPA1 propeptide. A PageRuler prestained protein ladder was used to provide molecular mass markers (Fermentas).

Similar articles

Cited by

References

    1. Folk J. E., Schirmer E. W. (1965) J. Biol. Chem. 240, 181–192 - PubMed
    1. Folk J. E., Cole P. W. (1965) J. Biol. Chem. 240, 193–197 - PubMed
    1. Keil-Dlouha V., Puigserver A., Marie A., Keil B. (1972) Biochim. Biophys. Acta 276, 531–535 - PubMed
    1. Iio-Akama K., Sasamoto H., Miyazawa K., Miura S., Tobita T. (1985) Biochim. Biophys. Acta 831, 249–256 - PubMed
    1. Brown J. R., Cox D. J., Greenshields R. N., Walsh K. A., Yamasaki M., Neurath H. (1961) Proc. Natl. Acad. Sci. U.S.A. 47, 1554–1560 - PMC - PubMed

Publication types

LinkOut - more resources