

Mechanistic studies of the autoactivation of PAK2: a two-step model of cis initiation followed by trans amplification
- PMID: 21098037
- PMCID: PMC3024765
- DOI: 10.1074/jbc.M110.156505
Mechanistic studies of the autoactivation of PAK2: a two-step model of cis initiation followed by trans amplification
Abstract
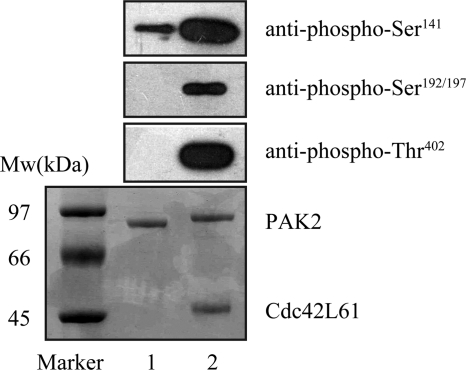
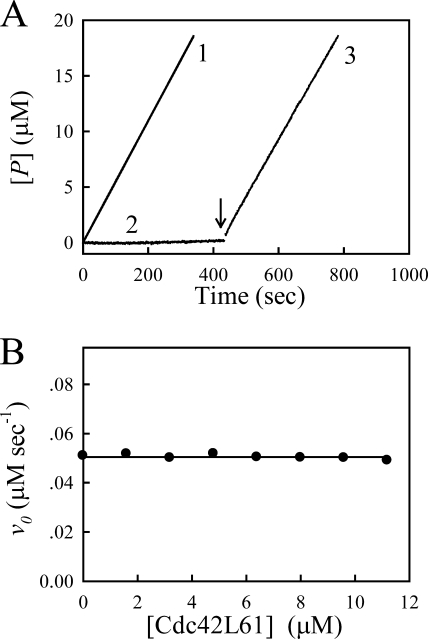
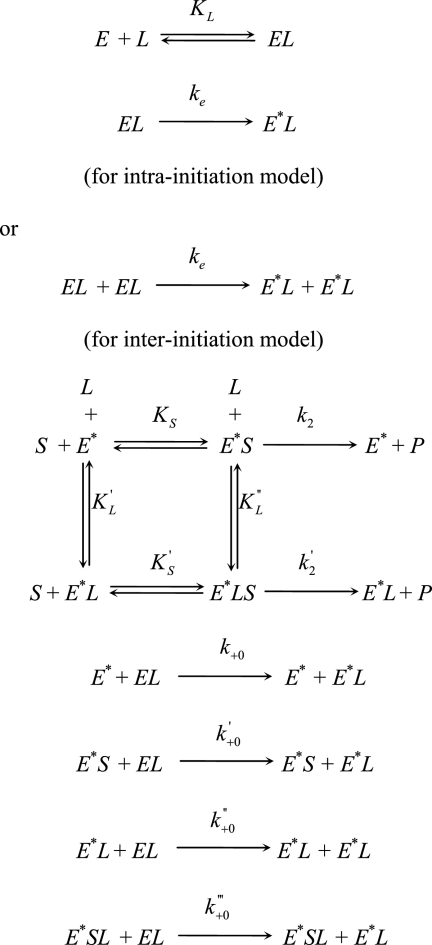
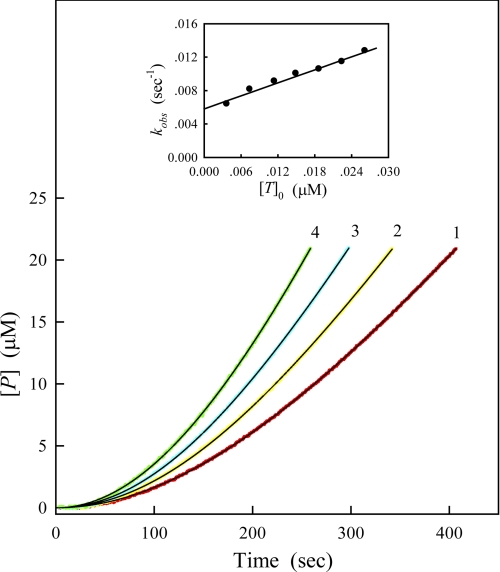
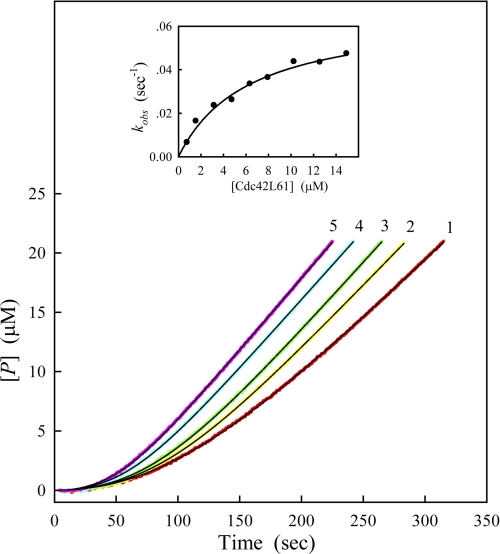
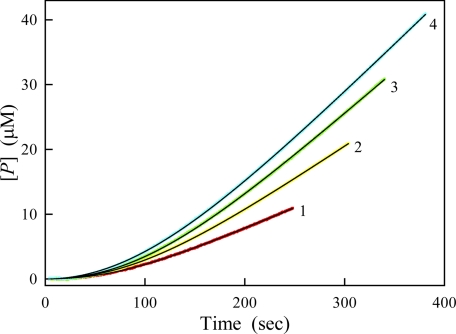
Protein kinase activation, via autophosphorylation of the activation loop, is a common regulatory mechanism in phosphorylation-dependent signaling cascades. Despite the prevalence of this reaction and its importance in biological regulation, the molecular mechanisms of autophosphorylation are poorly understood. In this study, we developed a kinetic approach to distinguish quantitatively between cis- and trans-pathways in an autocatalytic reaction. Using this method, we have undertaken a detailed kinetic analysis for the autoactivation mechanism of p21-activated protein kinase 2 (PAK2). PAK2 is regulated in vivo and in vitro by small GTP-binding proteins, Cdc42 and Rac. Full activation of PAK2 requires autophosphorylation of the conserved threonine, Thr(402), in the activation loop of its catalytic kinase domain. Analyses of the time courses of substrate reaction during PAK2 autoactivation suggest that autophosphorylation of Thr(402) in PAK2 obeys a two-step mechanism of cis initiation, followed by trans amplification. The unphosphorylated PAK2 undergoes an intramolecular (cis) autophosphorylation on Thr(402) to produce phosphorylated PAK2, and this newly formed active PAK2 then phosphorylates other PAK2 molecules at Thr(402) in an intermolecular (trans) manner. Based on the kinetic equation derived, all microscopic kinetic constants for the cis and trans autophosphorylation have been estimated quantitatively. The advantage of the new method is not only its usefulness in the study of fast activation reactions, but its convenience in the study of substrate effects on modification reaction. It would be particularly useful when the regulatory mechanism of the autophosphorylation reaction toward certain enzymes is being assessed.
Figures

Similar articles
-
The mechanism of p21-activated kinase 2 autoactivation.J Biol Chem. 2003 Oct 24;278(43):41768-78. doi: 10.1074/jbc.M308196200. Epub 2003 Aug 7. J Biol Chem. 2003. PMID: 12907671
-
Negative regulation of caspase 3-cleaved PAK2 activity by protein phosphatase 1.Sci China C Life Sci. 2008 Jan;51(1):1-11. doi: 10.1007/s11427-008-0006-z. Sci China C Life Sci. 2008. PMID: 18176785
-
Regulation of the interaction of Pak2 with Cdc42 via autophosphorylation of serine 141.J Biol Chem. 2005 Dec 2;280(48):40025-31. doi: 10.1074/jbc.M509075200. Epub 2005 Oct 4. J Biol Chem. 2005. PMID: 16204230
-
Regulation of Cancer Metastasis by PAK2.Int J Mol Sci. 2024 Dec 15;25(24):13443. doi: 10.3390/ijms252413443. Int J Mol Sci. 2024. PMID: 39769207 Free PMC article. Review.
-
Involvement of Rac/Cdc42/PAK pathway in cytoskeletal rearrangements.Acta Biochim Pol. 2009;56(2):225-34. Epub 2009 Jun 10. Acta Biochim Pol. 2009. PMID: 19513348 Review.
Cited by
-
Structural basis for basal activity and autoactivation of abscisic acid (ABA) signaling SnRK2 kinases.Proc Natl Acad Sci U S A. 2011 Dec 27;108(52):21259-64. doi: 10.1073/pnas.1118651109. Epub 2011 Dec 12. Proc Natl Acad Sci U S A. 2011. PMID: 22160701 Free PMC article.
-
The P21-Activated Kinase 1 and 2 As Potential Therapeutic Targets for the Management of Cardiovascular Disease.Int J Drug Discov Pharm. 2022 Dec 21:5. doi: 10.53941/ijddp.v1i1.179. Online ahead of print. Int J Drug Discov Pharm. 2022. PMID: 39899001 Free PMC article.
-
Solution structures and biophysical analysis of full-length group A PAKs reveal they are monomeric and auto-inhibited in cis.Biochem J. 2019 Apr 4;476(7):1037-1051. doi: 10.1042/BCJ20180867. Biochem J. 2019. PMID: 30858169 Free PMC article.
-
Myosin 3A kinase activity is regulated by phosphorylation of the kinase domain activation loop.J Biol Chem. 2013 Dec 27;288(52):37126-37. doi: 10.1074/jbc.M113.511014. Epub 2013 Nov 10. J Biol Chem. 2013. PMID: 24214986 Free PMC article.
-
The structural basis of the multi-step allosteric activation of Aurora B kinase.Elife. 2023 May 25;12:e85328. doi: 10.7554/eLife.85328. Elife. 2023. PMID: 37227118 Free PMC article.
References
Publication types
MeSH terms
Substances
LinkOut - more resources
Full Text Sources
Molecular Biology Databases
Miscellaneous
