

Mature natural killer cells with phenotypic and functional alterations accumulate upon sustained stimulation with IL-15/IL-15Ralpha complexes
- PMID: 21098276
- PMCID: PMC3003106
- DOI: 10.1073/pnas.1012128107
Mature natural killer cells with phenotypic and functional alterations accumulate upon sustained stimulation with IL-15/IL-15Ralpha complexes
Abstract
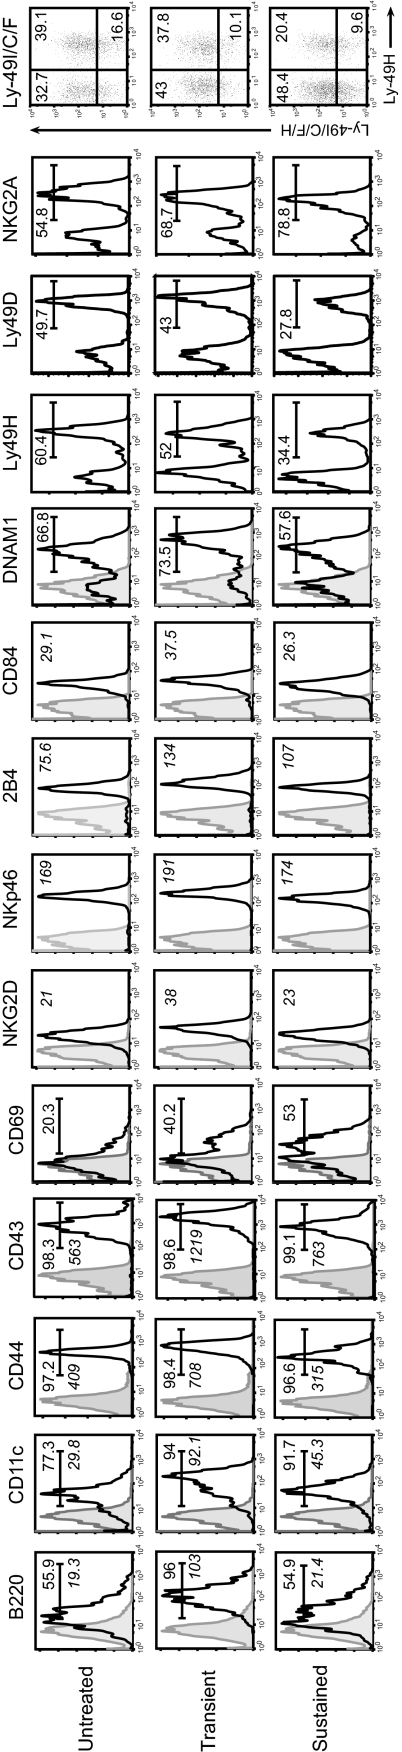
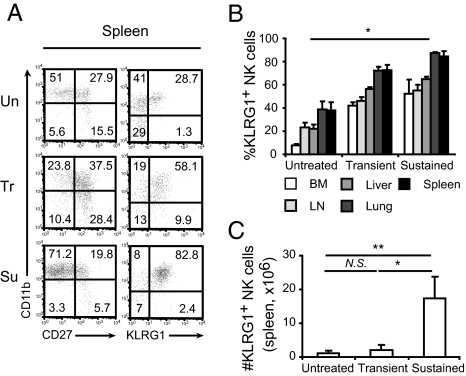
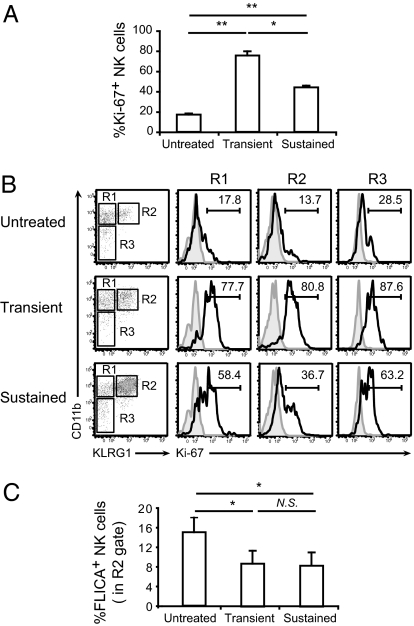
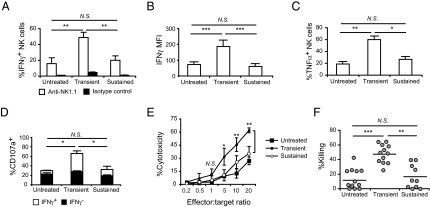
Cytotoxic lymphocytes such as natural killer (NK) and CD8 T cells play important roles in immunosurveillance by killing virally infected or malignant cells. The homeostatic cytokine, IL-15, promotes the development, function, and survival of NK and CD8 T cells. IL-15 is normally presented in trans as a surface complex with IL-15 receptor-alpha-chain (IL-15Rα) by dendritic cells (DCs) and monocytes. Signaling by IL-15 occurs via the IL-2/IL-15 receptor β-chain (CD122) which is expressed primarily by NK1.1(+) cells and CD8 T cells. The use of preformed complexes of IL-15 with soluble IL-15Rα complexes to boost the effector function of CD122(+) cytolytic lymphocytes such as NK and CD8 T cells has recently gained considerable attention. Here we describe the impact of transient and prolonged in vivo stimulation by IL-15/IL-15Rα complexes on NK and CD8 T cells. Whereas transitory stimulation increased the number of activated NK cells and significantly enhanced their effector function, prolonged stimulation by IL-15/IL-15Rα complexes led to a marked accumulation of mature NK cells with considerably impaired activation, cytotoxicity, and proliferative activity, and an altered balance of activating and inhibitory receptors. In contrast to NK cells, CD8 T cells exhibited an activated phenotype and robust T cell receptor stimulation and effector function upon chronic stimulation with IL-15/IL-15Rα complexes. Thus, prolonged stimulation with the strong activating signal leads to a preferential accrual of mature NK cells with altered activation and diminished functional capacity. These findings point to a negative feedback mechanism to preferentially counterbalance excessive NK cell activity and may have important implications for cytokine immunotherapy.
Conflict of interest statement
The authors declare no conflict of interest.
Figures
Similar articles
-
IL-15R alpha-IgG1-Fc enhances IL-2 and IL-15 anti-tumor action through NK and CD8+ T cells proliferation and activation.J Mol Cell Biol. 2010 Aug;2(4):217-22. doi: 10.1093/jmcb/mjq012. J Mol Cell Biol. 2010. PMID: 20671116
-
Increasing the biological activity of IL-2 and IL-15 through complexing with anti-IL-2 mAbs and IL-15Rα-Fc chimera.Immunol Lett. 2014 May-Jun;159(1-2):1-10. doi: 10.1016/j.imlet.2014.01.017. Epub 2014 Feb 7. Immunol Lett. 2014. PMID: 24512738 Review.
-
IL-15Ralpha chaperones IL-15 to stable dendritic cell membrane complexes that activate NK cells via trans presentation.J Exp Med. 2008 May 12;205(5):1213-25. doi: 10.1084/jem.20071913. Epub 2008 May 5. J Exp Med. 2008. PMID: 18458113 Free PMC article.
-
Development of IL-15/IL-15Rα sushi domain-IgG4 Fc complexes in Pichia pastoris with potent activities and prolonged half-lives.Microb Cell Fact. 2021 Jun 9;20(1):115. doi: 10.1186/s12934-021-01605-3. Microb Cell Fact. 2021. PMID: 34107983 Free PMC article.
-
IL-15 receptor alpha as the magic wand to boost the success of IL-15 antitumor therapies: The upswing of IL-15 transpresentation.Pharmacol Ther. 2017 Feb;170:73-79. doi: 10.1016/j.pharmthera.2016.10.012. Epub 2016 Oct 21. Pharmacol Ther. 2017. PMID: 27777088 Review.
Cited by
-
NK cells of the oldest seniors represent constant and resistant to stimulation high expression of cellular protective proteins SIRT1 and HSP70.Immun Ageing. 2018 Mar 6;15:12. doi: 10.1186/s12979-018-0115-x. eCollection 2018. Immun Ageing. 2018. PMID: 29541147 Free PMC article.
-
Development of Automated Separation, Expansion, and Quality Control Protocols for Clinical-Scale Manufacturing of Primary Human NK Cells and Alpharetroviral Chimeric Antigen Receptor Engineering.Hum Gene Ther Methods. 2019 Jun;30(3):102-120. doi: 10.1089/hgtb.2019.039. Epub 2019 May 16. Hum Gene Ther Methods. 2019. PMID: 30997855 Free PMC article.
-
Continuous treatment with IL-15 exhausts human NK cells via a metabolic defect.JCI Insight. 2018 Feb 8;3(3):e96219. doi: 10.1172/jci.insight.96219. eCollection 2018 Feb 8. JCI Insight. 2018. PMID: 29415897 Free PMC article.
-
IL-15, TIM-3 and NK cells subsets predict responsiveness to anti-CTLA-4 treatment in melanoma patients.Oncoimmunology. 2016 Dec 7;6(2):e1261242. doi: 10.1080/2162402X.2016.1261242. eCollection 2017. Oncoimmunology. 2016. PMID: 28344869 Free PMC article.
-
Interleukin-15 and cancer: some solved and many unsolved questions.J Immunother Cancer. 2020 Nov;8(2):e001428. doi: 10.1136/jitc-2020-001428. J Immunother Cancer. 2020. PMID: 33203664 Free PMC article. Review.
References
-
- Cerwenka A, Lanier LL. Natural killer cells, viruses and cancer. Nat Rev Immunol. 2001;1:41–49. - PubMed
-
- Yokoyama WM. Natural killer cell immune responses. Immunol Res. 2005;32:317–325. - PubMed
-
- Lanier LL. NK cell recognition. Annu Rev Immunol. 2005;23:225–274. - PubMed
-
- Vivier E, Nunès JA, Vély F. Natural killer cell signaling pathways. Science. 2004;306:1517–1519. - PubMed
Publication types
MeSH terms
Substances
Grants and funding
LinkOut - more resources
Full Text Sources
Other Literature Sources
Molecular Biology Databases
Research Materials
