. 2010 Dec 14;107(50):21842-7.
doi: 10.1073/pnas.1009956107. Epub 2010 Nov 22.

Trial-to-trial variability of the prefrontal neurons reveals the nature of their engagement in a motion discrimination task

Affiliations

Trial-to-trial variability of the prefrontal neurons reveals the nature of their engagement in a motion discrimination task

Cory Hussar et al. Proc Natl Acad Sci U S A. .

Abstract

During motion discrimination tasks, many prefrontal cortex (PFC) neurons are strongly modulated by the behavioral context, suggesting their involvement in sensory discriminations. Recent studies suggest that trial-to-trial variability of spiking activity characteristic of cortical neurons could be a source of information about the state of neurons and their participation in behavioral tasks. We tested this hypothesis by examining the variability of putative pyramidal PFC neurons, a likely source of top-down influences. The variability of these neurons was calculated as a ratio of spike count variance to its mean (fano factor, FF), while monkeys compared the directions of two moving stimuli, sample and test, separated by a delay. We found that the FF tracked consecutive components of the task, dropping rapidly with the onset of stimuli being discriminated and declining more slowly before each salient event of the trial: The sample, the test, and the response. These time-dependent signals were less consistent in direction selective neurons and were largely absent during passive fixation. Furthermore, neurons with test responses that reflected the remembered sample decreased their FF well before the test, revealing the predictive nature of response variability, an effect present only during the active task. The FF was also sensitive to behavioral performance, exhibiting different temporal dynamics on error trials. These changes did not depend on firing rates and were often the only metric correlated with task demands. Our results demonstrate that trial-to-trial variability provides a sensitive measure of the engagement of putative pyramidal PFC neurons in circuits subserving discrimination tasks.


Conflict of interest statement

The authors declare no conflict of interest.

Figures

Fig. 1.
Fig. 1.
Behavioral task and performance. (A) Direction discrimination task. The monkeys reported whether sample and test moved in the same direction or different directions by pressing one of two response buttons while maintaining fixation on a small square within a 2° window. (B) Passive fixation task. Stimulus conditions were identical to the direction task, except for a different fixation target (X), and the animals were not required to make a response to receive a reward. (C) Behavioral performance. Average psychometric functions for the two monkeys measured during the direction discrimination task (monkey 1, 64 sessions; monkey 2, 56 sessions). During each recording session, consisting of 150–300 trials, direction thresholds were measured by varying the direction differences between sample and test, and these differences were selected to bracket each animal's threshold, ensuring the overall performance level at 75–80% correct. The 4° circular stimuli, presented at the fovea, moved at 2°/s or 4°/s.
Fig. 2.
Fig. 2.
Responses and variability during the sample and the test. (A) Activity of neurons with excitatory (n = 64) and suppressive (n = 31) responses to the sample and the test. Baseline activity recorded 200 ms before stimulus onset was subtracted from each neuron's response. (B) Comparison of responses during sample and test (n = 95). Each data point represents maximal relative response recorded during the 200-ms period of the stimulus. Responses of suppressive cells were reflected above 0. Test responses were larger than sample responses (P = 0.00001; Wilcoxon signed-rank test). (C) Average FF of responses shown in A. (D) Comparison of stimulus-induced drop in FF for all excitatory (filled circles) and suppressive neurons (open circles) during both stimuli. The FFRI compared activity before (−400 ms) and after (100 ms) stimulus onset: FFRI = (FF100ms − FF−400ms)/(FF100ms + FF−400). FFRI for sample and test were similar for excitatory or suppressive neurons (P = 0.95 and 0.39; Wilcoxon signed-rank test). SEM is indicated by shadings around curves.
Fig. 3.
Fig. 3.
Direction selectivity and trial-to-trial variability. (A) Directionality of neurons classified as DS (n = 63) and non-DS (n = 32). (B) Average FF calculated separately for DS and non-DS neurons. (C) Distribution of indices showing modulation of the FF across time in trial (FFMI) calculated as [FFlate − FFearly]/[FFlate − FFearly]. Early, spike counts in a 200-ms window centered at −900 ms (fixation), 950 ms (delay), and 2,800 ms (posttest) relative to sample onset. Late, counts at 100 ms, 1,800 ms, and 3,300 ms for the same periods. The significance of FFMI in individual neurons was evaluated with a bootstrap test (filled columns, P < 0.05). Arrows indicate average FFMI for each distribution. DS cells showed no significant shift (fixation, P = 0.41; delay, P = 0.09; posttest, P = 0.97; Wilcoxon-signed rank test). Non-DS cells showed a significant shift, indicative of time-dependent reduction in FF (fixation, P = 0.024; delay, P = 0.022; posttest, P = 0.004; Wilcoxon-signed rank test).
Fig. 4.
Fig. 4.
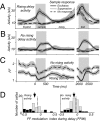
Lower variability of neurons with rising delay activity. (A and B) Activity of neurons with (n = 42) and without (n = 63) rising delay rates. Neurons with excitatory (n = 20/41), suppressive (n = 16/14), and no sample response (n = 6/8), the first number in parenthesis refers to cell numbers with delay activity and the second number to cells without delay activity. (C) Variability of cells with and without rising delay activity. The FF was evaluated together for cells with three types of sample responses. Variability of the two groups was different throughout the trial (P < 0.05, Mann–Whitney U) except late test response (300–550 ms, P > 0.05, Mann–Whitney U). (D) Modulation of variability during the delay, FFMI= (FFlate − FFearly)/(FFlate + FFearly) compared last 200 ms period of delay (late) and (early) delay period centered at 300 ms after sample offset. Distributions of FFMIs for both cell groups indicated a decrease in FF (P = 0.0036 and 0.0013, Wilcoxon signed-rank test). Black columns show cells with significant FFMI (bootstrap test, P < 0.05).
Fig. 5.
Fig. 5.
Variability is affected by the change in task demands. Variability during the direction task (solid lines) and the passive fixation task (broken lines) for DS (n = 32) (A) and non-DS (n = 12) (B) neurons. (C) Comparison of stimulus-induced drop in the FF during the two tasks. The drop was quantified by computing the FFRI (Fig. 2). (Left) Sample, the decline was similar during the two tasks (DS, P = 0.63; non-DS, P = 0.42). (Right) Test, the FF was significantly different for both cell groups (DS, P = 0.03; non-DS, P = 0.04) showing higher FF during passive fixation. (D and E) FFMI during nonstimulus periods for DS (D) and non-DS (E) neurons. The FFMI compared early and late time points for each period (Fig. 3) for the two cell groups: fixation, −800 and −200 ms; delay, 800 and 1,800 ms; posttest, 2,800 and 3,400 ms. Asterisks denote significant FFMI: P < 0.05; Wilcoxon signed-rank test).
Fig. 6.
Fig. 6.
Variability during the delay predicts comparison effects during the test. (A) Comparison signals during the test. Comparison effects for neurons firing more on same trials (same > different, n = 10), neurons firing less on same trials (same < different, n = 16) and neurons with no comparison effects (gray line, n = 44). (B) Distribution of comparison effects for all test responsive neurons with sufficient trials (n = 70). Black columns indicate significant effects (P < 0.05, Wilcoxon signed-rank test). (C) Average FF for neurons with and without comparison effects. Black line along the x axis shows periods of significant differences between the two cell groups (P < 0.05, Mann–Whitney U). FFMI quantified the drop in FF in early delay: FFMI = (FFmiddle − FFearly)/(FFmiddle + FFearly), comparing FF during 200-ms bins centered at 200 and 750ms from sample offset. (D) Distribution of FFMI showing decline in variability in early delay for cells with comparison effects. The shift toward negative values was significant only in cells showing the effect (P = 0.003 vs. 0.86, Wilcoxon signed-rank test). (E) Average FF of neurons with comparison effects (n = 12) during direction task (solid line) and during passive fixation. (F) FFMI for direction task and passive fixation. The data show significant shift in FFMI during the direction task (P = 0.001) but not during passive fixation (P = 0.57).
Fig. 7.
Fig. 7.
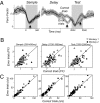
Variability on error trials. (A) Neural variability in correct (solid line) and error (broken line) trials. Only neurons with >10 errors in each condition were analyzed (n = 88). Arrows point to centers of 200-ms bins used to calculate the FF shown in B. (B) FF on correct and error trials during periods in the task indicated by arrows in A. Open and filled circles show data for monkeys 1 and 2, respectively. Sample, FF on correct and error trials were similar (P = 0.23; Wilcoxon signed-rank test). Late delay and late test, FF on error trials was lower (delay, P = 0.011; test, 0.024). There were no differences between the two monkeys (sample, P = 0.1; delay, 0.17; test, P = 0.12). (C) Firing rates on correct and error trials during the periods shown in B. There were no differences between rates on correct and error trials (sample, P = 0.97; delay, P = 0.85; test, P = 0.79).

Similar articles

Cited by

References

    1. Miller EK. The prefrontal cortex and cognitive control. Nat Rev Neurosci. 2000;1:59–65. - PubMed
    1. Miller EK, Cohen JD. An integrative theory of prefrontal cortex function. Annu Rev Neurosci. 2001;24:167–202. - PubMed
    1. Hussar CR, Pasternak T. Flexibility of sensory representations in prefrontal cortex depends on cell type. Neuron. 2009;64:730–743. - PMC - PubMed
    1. Zaksas D, Pasternak T. Directional signals in the prefrontal cortex and in area MT during a working memory for visual motion task. J Neurosci. 2006;26:11726–11742. - PMC - PubMed
    1. Freedman DJ, Riesenhuber M, Poggio T, Miller EK. Categorical representation of visual stimuli in the primate prefrontal cortex. Science. 2001;291:312–316. - PubMed

Publication types

MeSH terms

LinkOut - more resources