

Integrative genomic analysis of medulloblastoma identifies a molecular subgroup that drives poor clinical outcome
- PMID: 21098324
- PMCID: PMC3082983
- DOI: 10.1200/JCO.2010.28.5148
Integrative genomic analysis of medulloblastoma identifies a molecular subgroup that drives poor clinical outcome
Abstract
Purpose: Medulloblastomas are heterogeneous tumors that collectively represent the most common malignant brain tumor in children. To understand the molecular characteristics underlying their heterogeneity and to identify whether such characteristics represent risk factors for patients with this disease, we performed an integrated genomic analysis of a large series of primary tumors.
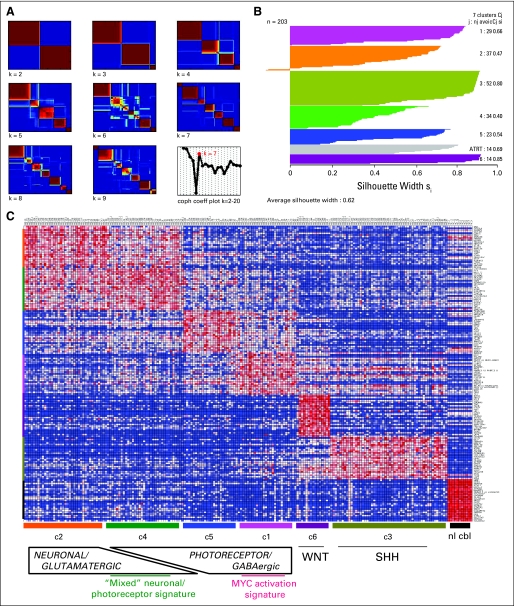
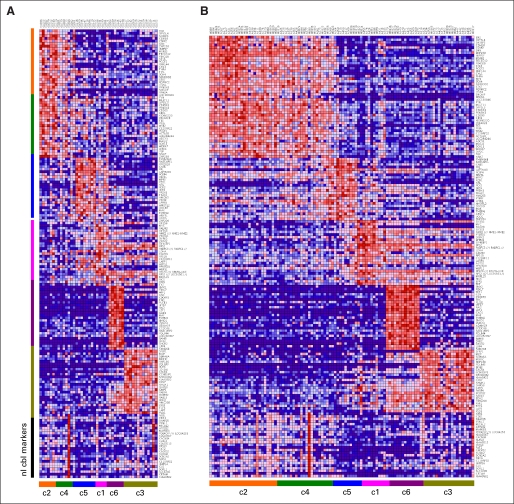
Patients and methods: We profiled the mRNA transcriptome of 194 medulloblastomas and performed high-density single nucleotide polymorphism array and miRNA analysis on 115 and 98 of these, respectively. Non-negative matrix factorization-based clustering of mRNA expression data was used to identify molecular subgroups of medulloblastoma; DNA copy number, miRNA profiles, and clinical outcomes were analyzed for each. We additionally validated our findings in three previously published independent medulloblastoma data sets.
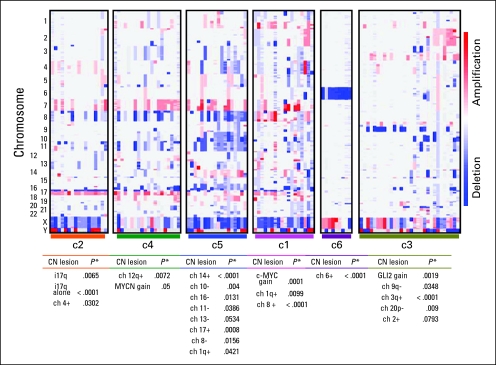
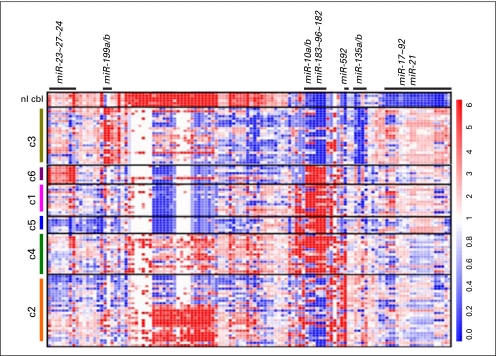
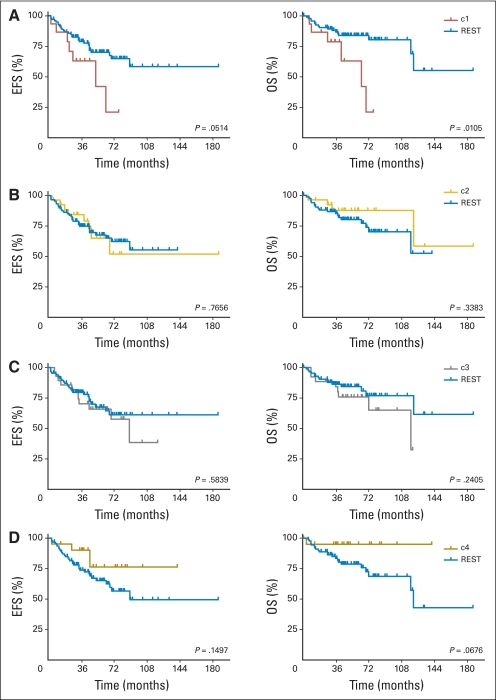
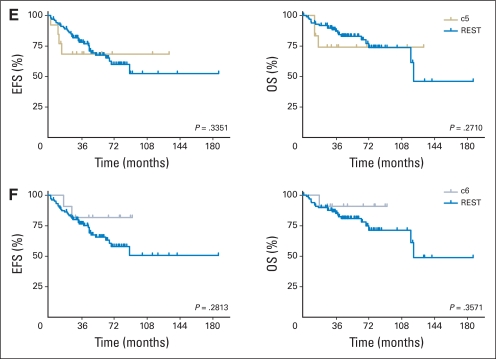
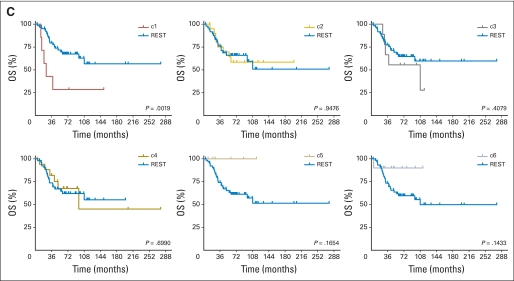
Results: Identified are six molecular subgroups of medulloblastoma, each with a unique combination of numerical and structural chromosomal aberrations that globally influence mRNA and miRNA expression. We reveal the relative contribution of each subgroup to clinical outcome as a whole and show that a previously unidentified molecular subgroup, characterized genetically by c-MYC copy number gains and transcriptionally by enrichment of photoreceptor pathways and increased miR-183∼96∼182 expression, is associated with significantly lower rates of event-free and overall survivals.
Conclusion: Our results detail the complex genomic heterogeneity of medulloblastomas and identify a previously unrecognized molecular subgroup with poor clinical outcome for which more effective therapeutic strategies should be developed.
Conflict of interest statement
Authors' disclosures of potential conflicts of interest and author contributions are found at the end of this article.
Figures
Comment in
- 1395 doi: 10.1200/JCO.2010.34.0547
References
-
- Pomeroy SL, Tamayo P, Gaasenbeek M, et al. Prediction of central nervous system embryonal tumour outcome based on gene expression. Nature. 2002;415:436–442. - PubMed
-
- Thompson MC, Fuller C, Hogg TL, et al. Genomics identifies medulloblastoma subgroups that are enriched for specific genetic alterations. J Clin Oncol. 2006;24:1924–1931. - PubMed
-
- Kim JY, Nelson AL, Algon SA, et al. Medulloblastoma tumorigenesis diverges from cerebellar granule cell differentiation in patched heterozygous mice. Dev Biol. 2003;263:50–66. - PubMed
Publication types
MeSH terms
Substances
Grants and funding
- R01 CA129541/CA/NCI NIH HHS/United States
- R01-GM074024/GM/NIGMS NIH HHS/United States
- R01 NS055089/NS/NINDS NIH HHS/United States
- R33-CA97556-01/CA/NCI NIH HHS/United States
- R01 CA109467/CA/NCI NIH HHS/United States
- U54 CA112962/CA/NCI NIH HHS/United States
- R01 CA121941/CA/NCI NIH HHS/United States
- R33 CA097556/CA/NCI NIH HHS/United States
- R01-109467/PHS HHS/United States
- R01 GM074024/GM/NIGMS NIH HHS/United States
- 6R01-CA-121941-04/CA/NCI NIH HHS/United States
- P30 HD018655/HD/NICHD NIH HHS/United States
- R01-NS055089/NS/NINDS NIH HHS/United States
- P50-CA112962/CA/NCI NIH HHS/United States
LinkOut - more resources
Full Text Sources
Other Literature Sources
Molecular Biology Databases
