. 2011 Jan;138(1):45-54.
doi: 10.1242/dev.052985. Epub 2010 Nov 23.

The Rho kinase Rock2b establishes anteroposterior asymmetry of the ciliated Kupffer's vesicle in zebrafish

Affiliations

The Rho kinase Rock2b establishes anteroposterior asymmetry of the ciliated Kupffer's vesicle in zebrafish

Guangliang Wang et al. Development. 2011 Jan.

Abstract

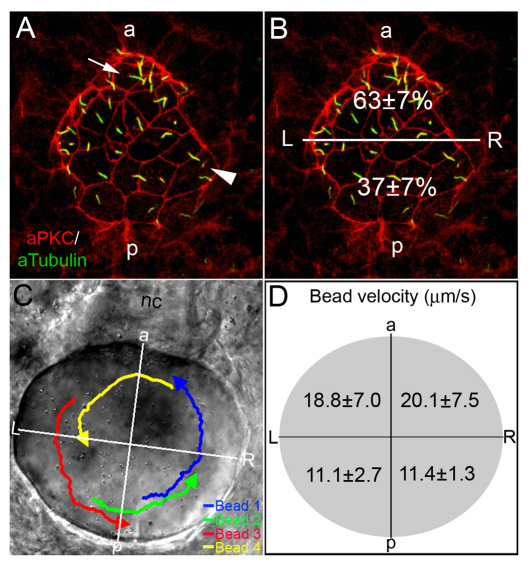
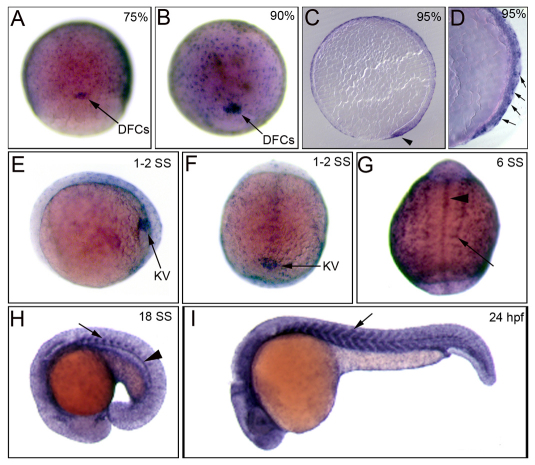
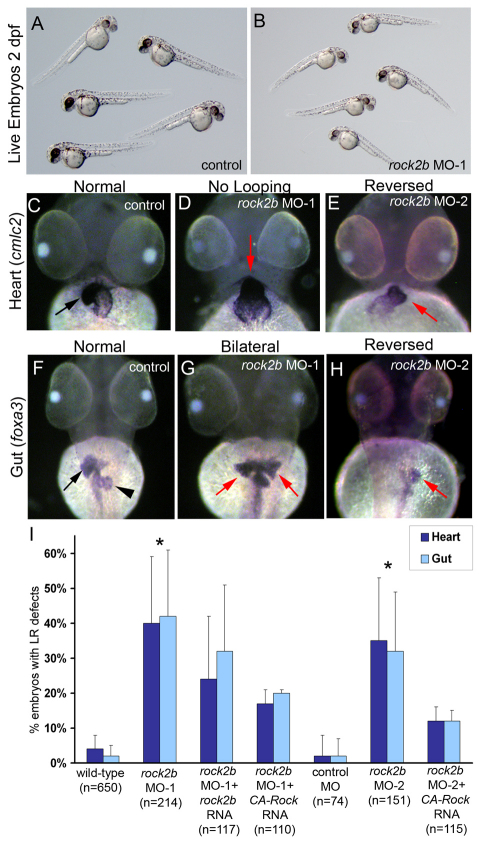
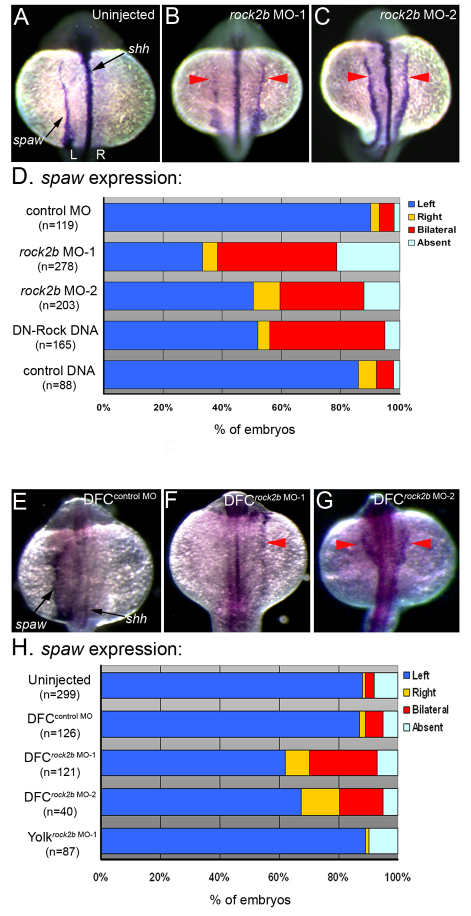
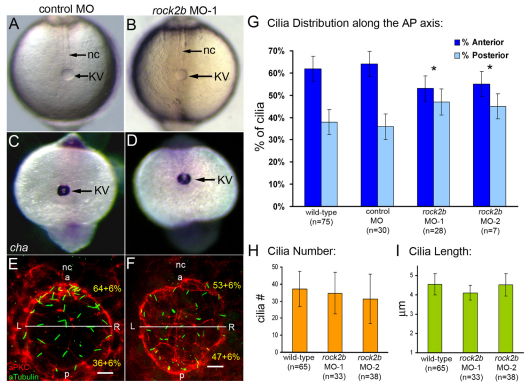
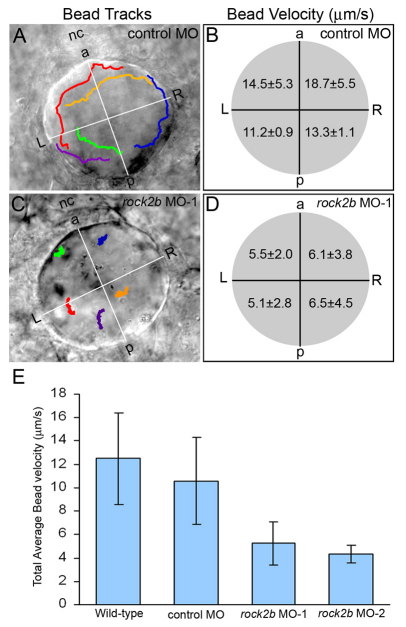
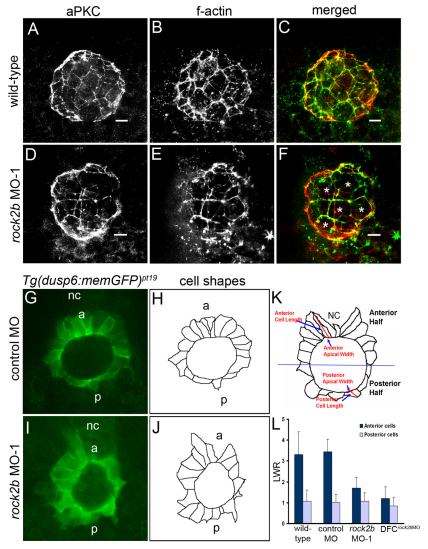
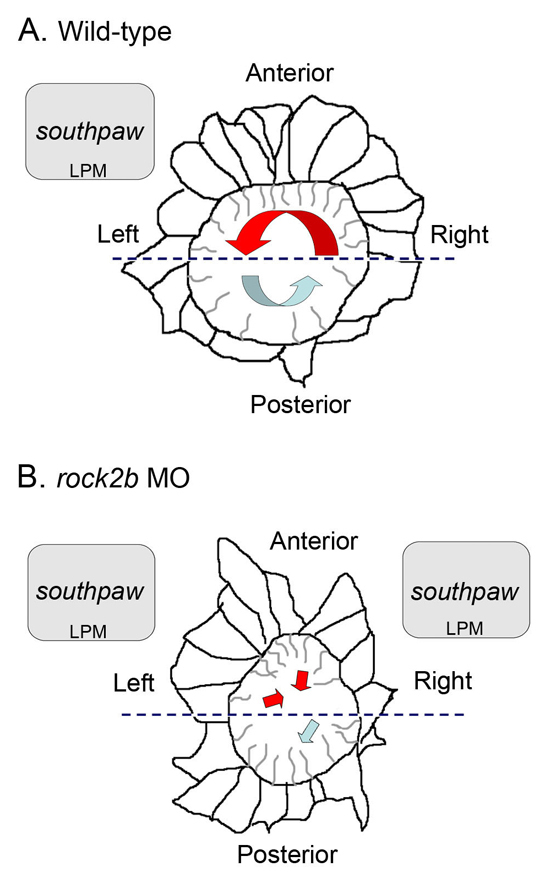
The vertebrate body plan features a consistent left-right (LR) asymmetry of internal organs. In several vertebrate embryos, motile cilia generate an asymmetric fluid flow that is necessary for normal LR development. However, the mechanisms involved in orienting LR asymmetric flow with previously established anteroposterior (AP) and dorsoventral (DV) axes remain poorly understood. In zebrafish, asymmetric flow is generated in Kupffer's vesicle (KV). The cellular architecture of KV is asymmetric along the AP axis, with more ciliated cells densely packed into the anterior region. Here, we identify a Rho kinase gene, rock2b, which is required for normal AP patterning of KV and subsequent LR development in the embryo. Antisense depletion of rock2b in the whole embryo or specifically in the KV cell lineage perturbed asymmetric gene expression in lateral plate mesoderm and disrupted organ LR asymmetries. Analyses of KV architecture demonstrated that rock2b knockdown altered the AP placement of ciliated cells without affecting cilia number or length. In control embryos, leftward flow across the anterior pole of KV was stronger than rightward flow at the posterior end, correlating with the normal AP asymmetric distribution of ciliated cells. By contrast, rock2b knockdown embryos with AP patterning defects in KV exhibited randomized flow direction and equal flow velocities in the anterior and posterior regions. Live imaging of Tg(dusp6:memGFP)(pt19) transgenic embryos that express GFP in KV cells revealed that rock2b regulates KV cell morphology. Our results suggest a link between AP patterning of the ciliated Kupffer's vesicle and LR patterning of the zebrafish embryo.


Figures

Fig. 1.
Fig. 1.
AP asymmetry in KV. (A,B) Fluorescent immunostaining of KV cells at 8-SS with aPKC (red) and acetylated tubulin (green) antibodies. To visualize individual cells, only the dorsal surface of KV is shown. Cells in the posterior region of KV had large apical surfaces (arrowhead), whereas cells in the anterior region had smaller apical surfaces (arrow). Counting all KV cilia in wild-type embryos (n=13), revealed a significant difference (P=3.60E-5) in the positioning of cilia with 63% located in the anterior half of KV and 37% are in the posterior region (B). (C,D) Tracking fluorescent beads injected into KV shows fluid flow velocity is asymmetric. (C) Paths of beads and the AP and LR axes of KV, relative to the notochord, have been superimposed onto a DIC image of KV. (D) The average velocity of 23 beads from 5 wild-type embryos in quadrants of KV indicated that flow was significantly stronger from right to left in the anterior region than in the posterior of KV (P<0.05). Numbers are averages ± one s.d. L, left; R, right; a, anterior; p, posterior; nc, notochord.
Fig. 2.
Fig. 2.
rock2b is expressed in the DFC/KV cell lineage. (A,B) Whole embryo RNA in situ hybridization staining shows rock2b is expressed in DFCs (arrows) and the enveloping layer at 75% (A), 90% epiboly (B). (C,D) Sagittal sections of stained embryos at 95% epiboly show rock2b expression in DFCs (arrowhead) and the EVL (arrows). (E,F) During early SSs, rock2b is detected in KV cells (arrow). (E) is a lateral view at 1- to 2-SS and (F) is a dorsal view. (G-I) During later somitogenesis, rock2b is expressed in somites (arrows) and midline structures including the hypochord and notochord (arrowheads).
Fig. 3.
Fig. 3.
rock2b knockdown alters heart and gut laterality. (A,B) Embryos injected with a low dose of rock2b MO-1 (B) appeared similar to wild-type controls (A) at 2 dpf, (C-E) Analysis of heart looping at 2 dpf by cmlc2 RNA in situ hybridizations revealed normal rightward looping in control embryos (arrow in C), and LR defects including a failure of heart looping (arrow in D) and reversed looping (arrow in E) in rock2b MO embryos. (F-H) foxa3 was used to label liver (arrow) and pancreas (arrowhead) at 2 dpf. Controls showed normal asymmetric orientation of these organs (F), whereas they were often bilaterally symmetric (arrows in G) or in a reversed position (arrow in H) in rock2b MO embryos. (I) The percentage of embryos injected with MO or MO + rescue mRNA which showed heart and gut laterality defects are presented in the graph and in Table S1 in the supplementary material. *Significantly different (P<0.05) from wild-type and control MO embryos. Error bars indicate +1 s.d. n=number of embryos analyzed.
Fig. 4.
Fig. 4.
Rock2b function in DFC/KV cells is required for normal asymmetric southpaw expression. (A-C) spaw is normally expressed in left LPM in control embryos (A) at 16- to 18-SS. In contrast, spaw expression was often bilateral in rock2b MO embryos (red arrows in B,C). shh expression (see arrow in A) indicated that embryonic midline structures were intact. (D) The frequency of altered spaw expression (right, bilateral or absent) in control embryos and embryos injected with rock2b MO or DNA encoding DN-Rock proteins. (E-G) spaw expression was altered in DFCrock2b MO embryos (F,G), whereas normal left-sided expression was observed in most control DFCcontrol MO embryos (E). (H) The percentage of DFCrock2b MO and control embryos with spaw defects. n=number of embryos analyzed.
Fig. 5.
Fig. 5.
rock2b knockdown disrupts AP asymmetric arrangement of KV cilia without inhibiting KV lumen formation or ciliogenesis. (A,B) Light micrographs at 8-SS show KV lumen (arrow) appeared similar in control MO (A) and rock2b MO (B) embryos. Surrounding tailbud tissue and nc also appeared similar. (C,D) Normal cha expression around KV (arrow) in control MO (C) and rock2b MO (D) embryos at 10- to 12-SS. (E,F) Fluorescent immunostaining of KV using aPKC and acetylated tubulin antibodies in control MO (E) and rock2b MO (F) embryos at 8-SS. KV was bisected into anterior and posterior regions using the position of the nc. (G) The average AP distribution ± 1 s.d. is shown (also shown in yellow in E and F). *The AP distribution of ciliated cells was significantly different (P<0.01) from controls. (H,I). There were no statistical differences (P>0.05) in cilia number or length among wild-type (37±10 cilia; 4.5±0.5 μm), rock2b MO-1 (34±12 cilia; 4.1±0.4 μm) and rock2b MO-2 (32±15 cilia; 4.5±0.6 μm) embryos. Scale bars: 10 μm. Error bars: 1 s.d. nc, notochord; a, anterior; p, posterior; L, left; R, right. n=number of embryos analyzed.
Fig. 6.
Fig. 6.
Asymmetric KV fluid flow is disrupted by rock2b knockdown. (A,C) Tracks of fluorescent beads superimposed on DIC images of KV. Beads followed a counterclockwise path in control MO embryos (A), but this directional flow was lost in rock2b MO embryos (C). (B,D) Measurements of bead velocities in quadrants of KV showed that flow was stronger in the anterior region of control MO embryos (B; n=28 beads from six embryos), but velocities were similar in all quadrants of rock2b MO embryos (D; n=30 beads from seven embryos). (E) Total average flow velocity was reduced in rock2b MO embryos relative to controls. Average velocity is shown for uninjected (n=35 beads from seven embryos), control MO (n=30 beads from six embryos), rock2b MO-1 (n=70 beads from 14 embryos) and rock2b MO-2 (n=19 beads from four embryos) embryos. Error bar: 1 s.d. nc, notochord; a, anterior; p, posterior; L, left; R, right.
Fig. 7.
Fig. 7.
rock2b knockdown alters KV cell shapes. (A-F) KV cells at 8-SS double fluorescently labeled with aPKC antibodies (A,D) and phalloidin (B,E) to detect apical membrane and filamentous actin (f-actin), respectively. Apical actin structures were present and co-localized with aPKC similarly in wild-type (A-C) and rock2b MO-1 (D-F) embryos, but the architecture of KV appeared different in rock2b MO-1 embryos, in which more KV cells had large apical surfaces (examples are marked by * in F). (G,I) Confocal images of memGFP-labeled KV cells in live Tg(dusp6:memGFP)pt19 transgenic embryos injected with control MO (G) or rock2b MO-1 (I). (H,J) Diagrams show KV cell shapes traced from confocal images. (K) Diagram of KV cells in a wild-type embryo, with a description of how the LWR was measured in anterior and posterior KV cells. (L) The average LWR for wild-type (n=12 embryos) control MO (n=5) and rock2b MO-1 (n=15) and DFCrock2b MO-1 (n=4) embryos. Scale bars: 10 μm. Error bars: 1 s.d. nc, notochord; a, anterior; p, posterior.
Fig. 8.
Fig. 8.
Model of the relationship between KV architecture, fluid flow and asymmetric gene expression in wild-type and rock2b knockdown embryos. (A,B) Diagrams of KV cells traced from confocal images of Tg(dusp6:memGFP)pt19 transgenic embryos with representative cilia projecting into the KV lumen. (A) In wild-type embryos, a dense packing of elongated ciliated cells in the anterior half of KV (delineated by the dashed line) drives strong leftward flow (red arrow), and fewer cilia in the posterior half of KV move fluid rightward at a slower velocity (blue arrow). We propose anterior leftward fluid flow in KV triggers asymmetric spaw expression in left LPM. (B) rock2b MO knockdown disrupted KV cell morphology and placement along the AP axis, such that ciliated cells were equally distributed in the anterior and posterior regions. This alteration of KV architecture resulted in randomized flow direction and similar flow velocities in the anterior (red arrows) and posterior (blue arrow) regions. Disruption of KV architecture and asymmetric fluid flow resulted in abnormal initiation of spaw in LPM, which was frequently bilaterally symmetric.

Similar articles

Cited by

References

    1. Albertson R. C., Yan Y. L., Titus T. A., Pisano E., Vacchi M., Yelick P. C., Detrich H. W., 3rd, Postlethwait J. H. (2010). Molecular pedomorphism underlies craniofacial skeletal evolution in Antarctic notothenioid fishes. BMC Evol. Biol. 10, 4 - PMC - PubMed
    1. Amack J. D., Yost H. J. (2004). The T box transcription factor no tail in ciliated cells controls zebrafish left-right asymmetry. Curr. Biol. 14, 685-690 - PubMed
    1. Amack J. D., Wang X., Yost H. J. (2007). Two T-box genes play independent and cooperative roles to regulate morphogenesis of ciliated Kupffer's vesicle in zebrafish. Dev. Biol. 310, 196-210 - PubMed
    1. Antic D., Stubbs J. L., Suyama K., Kintner C., Scott M. P., Axelrod J. D. (2010). Planar cell polarity enables posterior localization of nodal cilia and left-right axis determination during mouse and Xenopus embryogenesis. PLoS One 5, e8999 - PMC - PubMed
    1. Borovina A., Superina S., Voskas D., Ciruna B. (2010). Vangl2 directs the posterior tilting and asymmetric localization of motile primary cilia. Nat. Cell. Biol. 12, 407-412 - PubMed

Publication types

MeSH terms