. 2010 Dec;137(24):4159-69.
doi: 10.1242/dev.056630.

Initiation of trophectoderm lineage specification in mouse embryos is independent of Cdx2

Affiliations

Initiation of trophectoderm lineage specification in mouse embryos is independent of Cdx2

Guangming Wu et al. Development. 2010 Dec.

Abstract

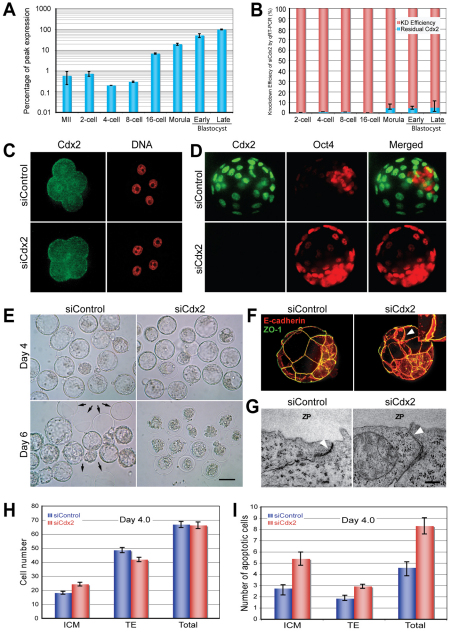
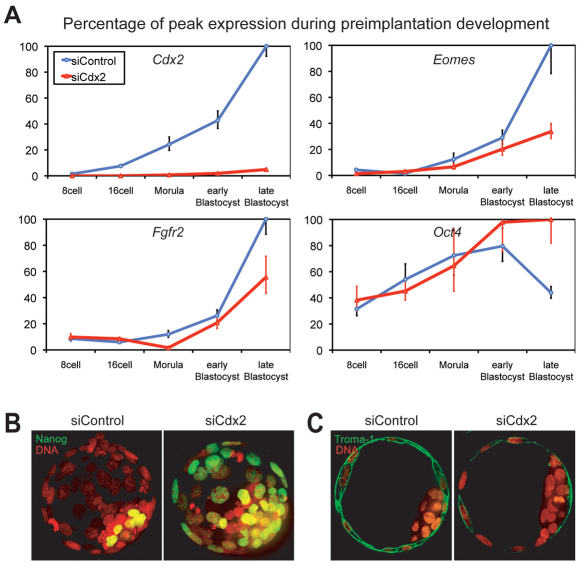
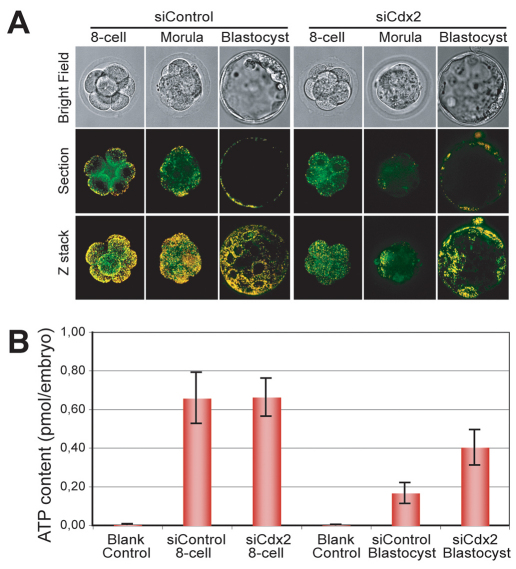
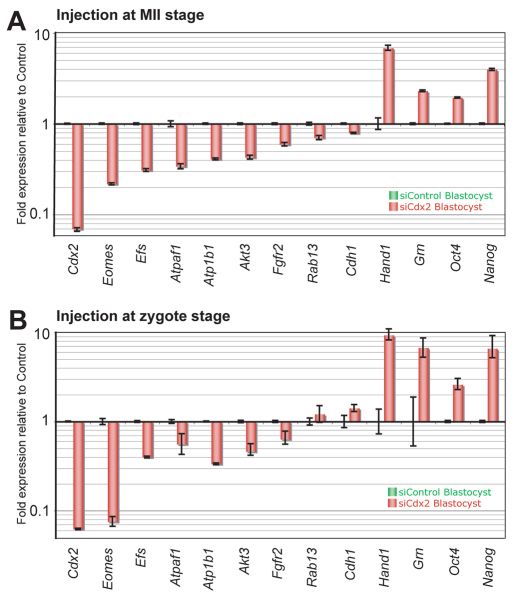
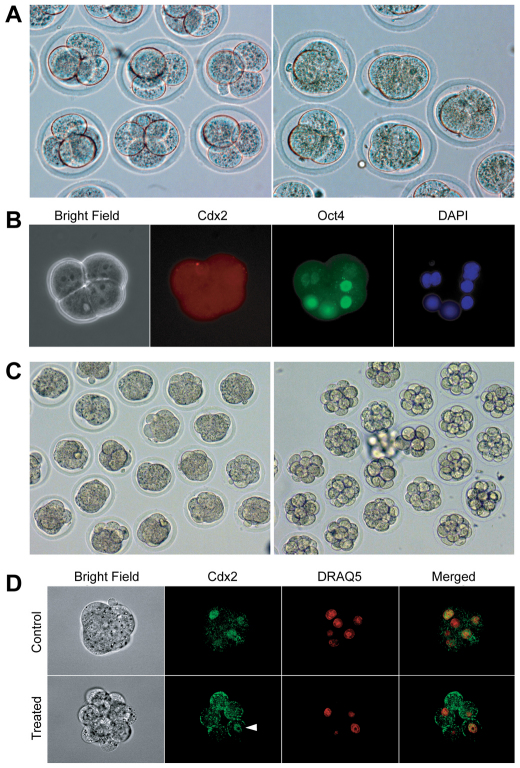
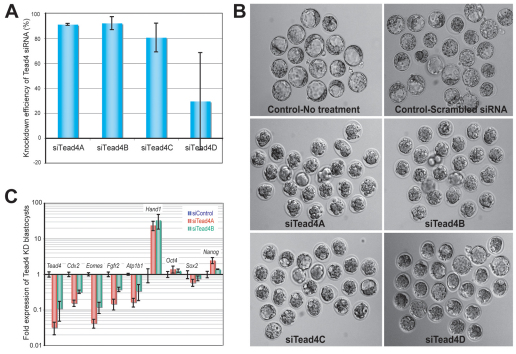
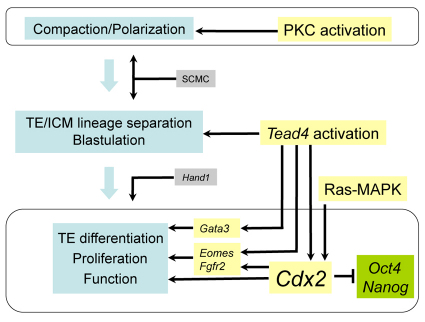
The separation of the first two lineages - trophectoderm (TE) and inner cell mass (ICM) - is a crucial event in the development of the early embryo. The ICM, which constitutes the pluripotent founder cell population, develops into the embryo proper, whereas the TE, which comprises the surrounding outer layer, supports the development of the ICM before and after implantation. Cdx2, the first transcription factor expressed specifically in the developing TE, is crucial for the differentiation of cells into the TE, as lack of zygotic Cdx2 expression leads to a failure of embryos to hatch and implant into the uterus. However, speculation exists as to whether maternal Cdx2 is required for initiation of TE lineage separation. Here, we show that effective elimination of both maternal and zygotic Cdx2 transcripts by an RNA interference approach resulted in failure of embryo hatching and implantation, but the developing blastocysts exhibited normal gross morphology, indicating that TE differentiation had been initiated. Expression of keratin 8, a marker for differentiated TE, further confirmed the identity of the TE lineage in Cdx2-deficient embryos. However, these embryos exhibited low mitochondrial activity and abnormal ultrastructure, indicating that Cdx2 plays a key role in the regulation of TE function. Furthermore, we found that embryonic compaction does not act as a 'switch' regulator to turn on Cdx2 expression. Our results clearly demonstrate that neither maternal nor zygotic Cdx2 transcripts direct the initiation of ICM/TE lineage separation.


Figures

Fig. 1.
Fig. 1.
Efficient reduction of Cdx2 mRNA and protein levels in different preimplantation stage mouse embryos by siCdx2 results in phenotypes similar to Cdx2 knockout. (A) Relative Cdx2 mRNA expression levels as a percentage of peak expression in mouse embryos at different preimplantation stages, as assessed by qRT-PCR. The maternal mRNA decreased at the 4-cell stage, followed by upregulation at the 8-cell stage due to the zygotic activation of Cdx2. Embryo collection times (post-hCG): 2-cell stage, 40 hours; 4-cell stage, 52 hours; 8-cell stage, 62 hours; 16-cell stage, 72 hours; morula, 85 hours; early blastocyst, 96 hours; late blastocyst, 115 hours. (B) A comparison of Cdx2 mRNA levels in siControl- and siCdx2-treated zygotes at different preimplantation stages demonstrated robust downregulation of Cdx2 by siCdx2 treatment. KD, knockdown. (C) Confocal images of 8-cell stage embryos immunolabeled with anti-Cdx2 monoclonal antibody illustrate the reduction of Cdx2 protein (green) by siCdx2 treatment. Red, nuclear counterstaining with DRAQ5. (D) Confocal images of blastocyst stage embryos immunolabeled with anti-Cdx2 (green) and anti-Oct4 (red) antibodies. Following siCdx2 treatment, Cdx2 was eliminated, but Oct4 was ectopically expressed in the trophectoderm (TE). (E) DIC images of E4.0 and E6.0 embryos. All siCdx2-treated embryos failed to hatch. Arrows indicate empty zonae pellucidae left by hatched control embryos. Scale bar: 100 μm. (F) Confocal images of ZO-1 (green) and E-cadherin (red) immunohistochemistry show normal E-cadherin distribution, which marks the lateral-basal cell boundary, but disoriented cell polarity of the TE, as indicated by the presence of ZO-1 at both the apical and basal sides (arrowhead and inset). (G) Defective tight junction (arrowhead) in the TE of a Cdx2-deficient blastocyst as shown by electron microscopy. Scale bar: 0.2 μM. (H) Effect of Cdx2 depletion on TE and inner cell mass (ICM) cell numbers. The number of ICM cells was significantly increased (P<0.01), but the total cell number remained unchanged (P=0.64) upon Cdx2 depletion. (I) Quantitation of apoptotic cells shows an increase in apoptotic activity in a Cdx2-deficient E4.0 blastocyst,. MII, metaphase II oocyte; ZP, zona pellucida. Error bars indicate standard deviation.
Fig. 2.
Fig. 2.
Significant effect of Cdx2 reduction on gene expression at various developmental stages but no blockage of expression of the differentiated TE marker Krt8. (A) Relative gene expression levels as a percentage of peak expression of Cdx2, Eomes, Fgfr2 and Oct4 in mouse preimplantation embryos after siControl and siCdx2 injection into zygotes. The downstream transcription factor Eomes was reduced to a basal level. Fgfr2 reduction is shown at the early and expanded blastocyst stages. Oct4 expression was increased ∼2-fold in both the early and expanded blastocyst stages (P<0.0001). Error bars indicate standard deviation. (B) Ectopic expression of Nanog in the TE of Cdx2-deficient blastocysts after microinjection of siCdx2 at the zygote stage. The embryonic stem cell marker Nanog was ectopically expressed in TE, as shown in this z-stack confocal image of an immunostained siCdx2-treated blastocyst. (C) Sectional confocal image showing the presence of Krt8 (as detected by the Troma-1 antibody) in an interrupted pattern in Cdx2 knockdown blastocysts.
Fig. 3.
Fig. 3.
Significant effect of Cdx2 knockdown on mitochondrial activity. (A) Confocal images showing mitochondrial activity as assessed by JC-1 staining at the 8-cell, morula and blastocyst stages. siCdx2 treatment significantly reduced mitochondrial activity, as indicated by the accumulation of the red aggregated form of JC-1 in the mitochondria (appears yellow, as all mitochondria were stained with the green form of JC-1). (B) Measurement of ATP content in individual embryos, showing a significant increase in ATP from 0.17 pmol to 0.41 pmol in Cdx2-deficient blastocysts. Error bars indicate standard deviation.
Fig. 4.
Fig. 4.
Relative gene expression levels in E4.0 blastocysts after microinjection of siCdx2 into MII oocytes and zygotes. Elimination of Cdx2 RNA by microinjection of siCdx2 into mouse (A) MII oocytes and (B) zygotes had similar effects on gene expression levels, as assessed by qRT-PCR. Cdx2 knockdown reduced expression of genes crucial in TE lineage differentiation, with overexpression of pluripotency-related genes. Error bars indicate standard deviation.
Fig. 5.
Fig. 5.
Neither induction nor blockage of embryonic compaction affects the activation of Cdx2 expression. (A) Premature compaction induced within 30 minutes of treatment with the PKC agonist DiC8 (right). Normal 4-cell stage mouse embryos are shown on the left, with obvious, individual blastomeres. (B) Cdx2 expression (red) could not be detected by immunocytochemistry 18 hours after DiC8 treatment. Nuclei are blue (DAPI) and Oct4 (a positive control for transcriptional activity of the treated embryos) green. (C) Compaction was inhibited by anti-E-cadherin (ECCD-1) antibody treatment for 24 hours (right). Normally compacted 14-cell stage embryos are shown on the left. (D) Cdx2 was detected (arrowhead) in uncompacted 12-cell stage embryos. Heavy cytoplasmic background (especially around the cell surface) was due to cross-reaction of ECCD-1 (rat IgG monoclonal), which was used at a very high concentration (200 μg/ml) to block embryo compaction, with the Cdx2 antibody (mouse IgG monoclonal).
Fig. 6.
Fig. 6.
Effective knockdown of Tead4 in preimplantation mouse embryos by microinjection of siRNA into zygotes reproduces the Tead4–/– embryo phenotype. (A) Tead4 knockdown efficiency (%) determined by qRT-PCR in a single E4.5 mouse blastocyst in comparison to the scrambled siRNA control. Error bars indicate standard deviation. (B) Failure of blastulation 72 hours (E3.5) after microinjection of siTead4A and siTead4B into mouse zygotes. In this particular experiment, 25 zygotes per group were successfully injected. Note that the phenotype is consistent and highly reproducible within the siTead4A and siTead4B groups (except for one embryo in each group that was blocked at the 2-cell stage), but was variable in groups with lower Tead4 knockdown efficiency. (C) Tead4 knockdown reduced the expression of genes crucial in TE lineage differentiation but did not reduce the expression of pluripotency-related genes. Shown are qRT-PCR results from pools of six embryos, with biological and technical triplicates.
Fig. 7.
Fig. 7.
Postulated TE differentiation regulatory network. Cdx2 is not required for the TE lineage specification but it is critical for further differentiation of TE. Interactions among the processes of compaction and cellular polarization could affect the distribution of Cdx2 along the inside/outside axis and influence tight junction formation and localization. These interactions could therefore affect ICM/TE lineage allocation. SCMC, subcortical maternal complex.

Similar articles

Cited by

References

    1. Arman E., Haffner-Krausz R., Chen Y., Heath J. K., Lonai P. (1998). Targeted disruption of fibroblast growth factor (FGF) receptor 2 suggests a role for FGF signaling in pregastrulation mammalian development. Proc. Natl. Acad. Sci. USA 95, 5082-5087 - PMC - PubMed
    1. Bai Y. Q., Yamamoto H., Akiyama Y., Tanaka H., Takizawa T., Koike M., Kenji Yagi O., Saitoh K., Takeshita K., Iwai T., et al. (2002). Ectopic expression of homeodomain protein CDX2 in intestinal metaplasia and carcinomas of the stomach. Cancer Lett. 176, 47-55 - PubMed
    1. Boiani M., Gambles V., Schöler H. R. (2004). ATP levels in clone mouse embryos. Cytogenet. Genome Res. 105, 270-278
    1. Boiani M., Gentile L., Gambles V. V., Cavaleri F., Redi C. A., Scholer H. R. (2005). Variable reprogramming of the pluripotent stem cell marker Oct4 in mouse clones: distinct developmental potentials in different culture environments. Stem Cells 23, 1089-1104 - PubMed
    1. Brulet P., Babinet C., Kemler R., Jacob F. (1980). Monoclonal antibodies against trophectoderm-specific markers during mouse blastocyst formation. Proc. Natl. Acad. Sci. USA 77, 4113-4117 - PMC - PubMed

Publication types

MeSH terms