. 2011 Feb;155(2):932-43.
doi: 10.1104/pp.110.168328. Epub 2010 Nov 23.

The role of alpha-glucosidase in germinating barley grains

Affiliations

The role of alpha-glucosidase in germinating barley grains

Duncan Stanley et al. Plant Physiol. 2011 Feb.

Abstract

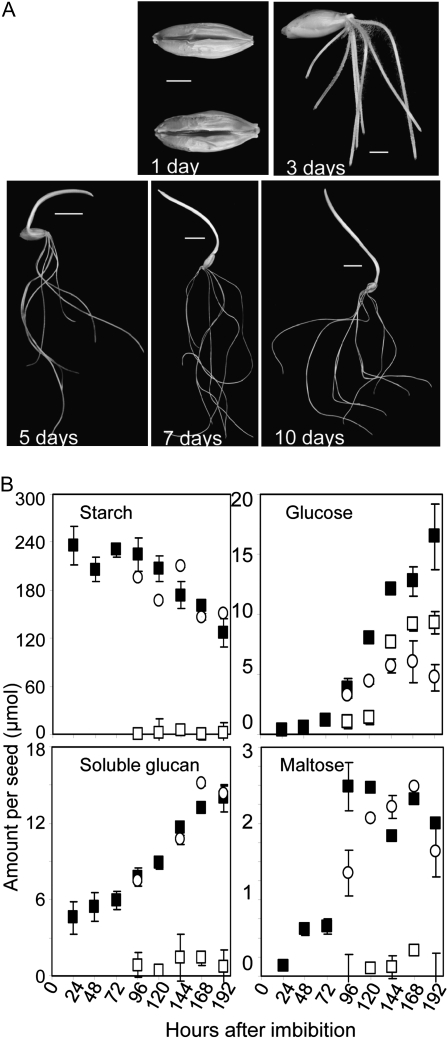
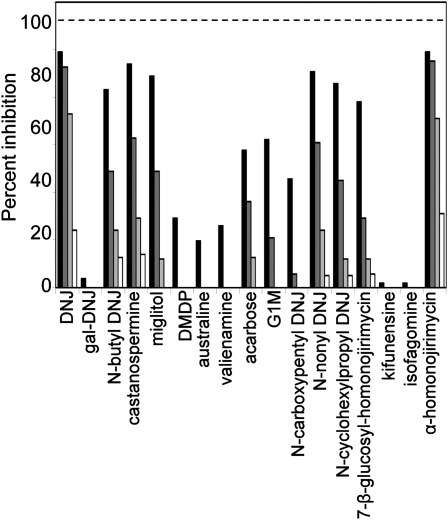
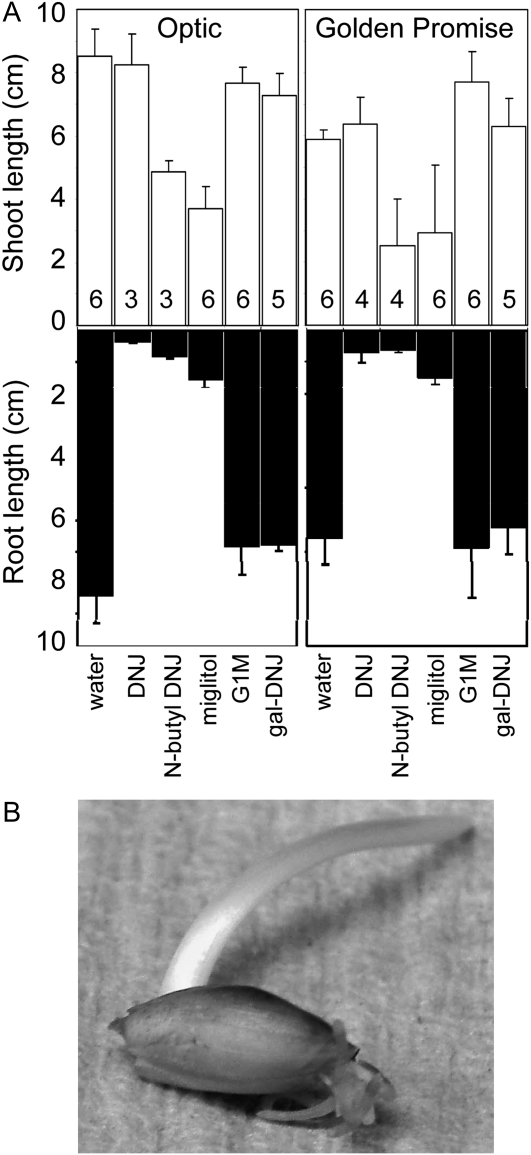
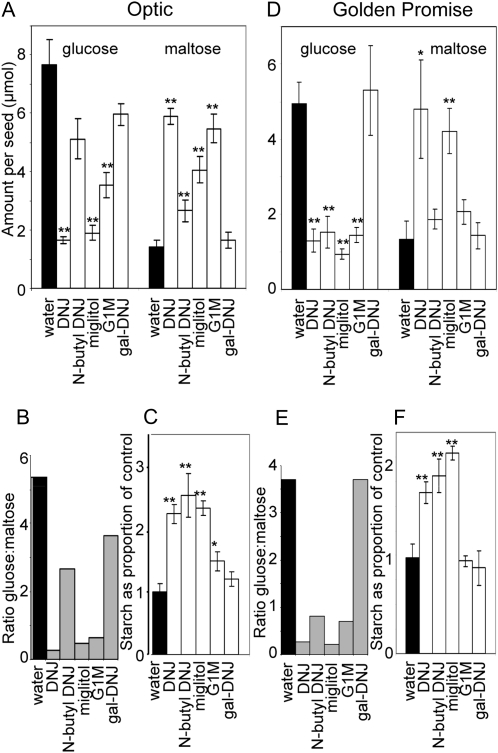
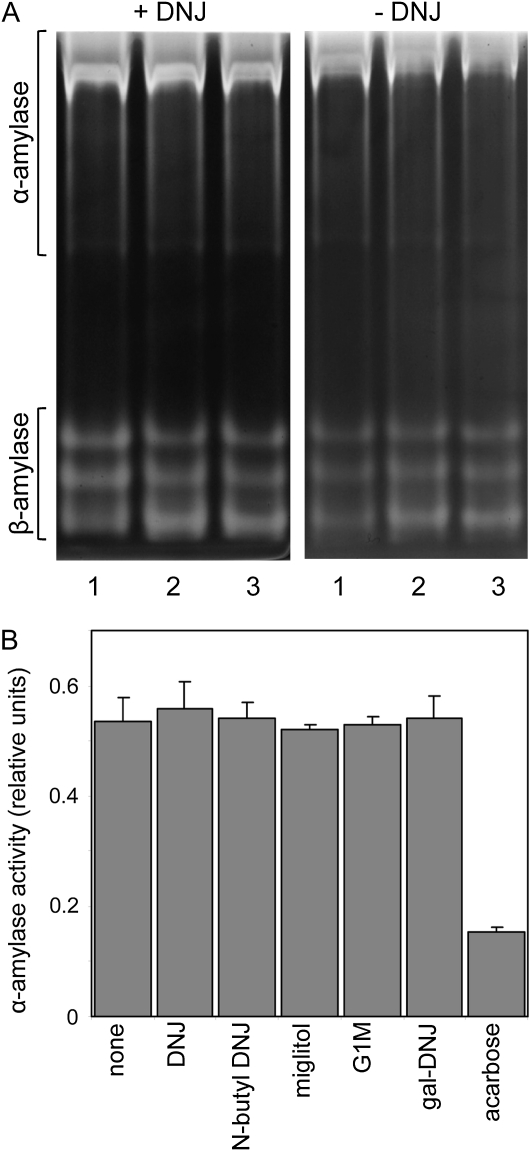
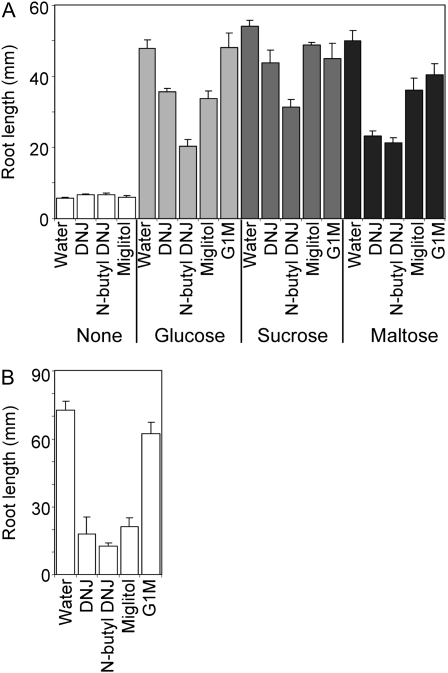
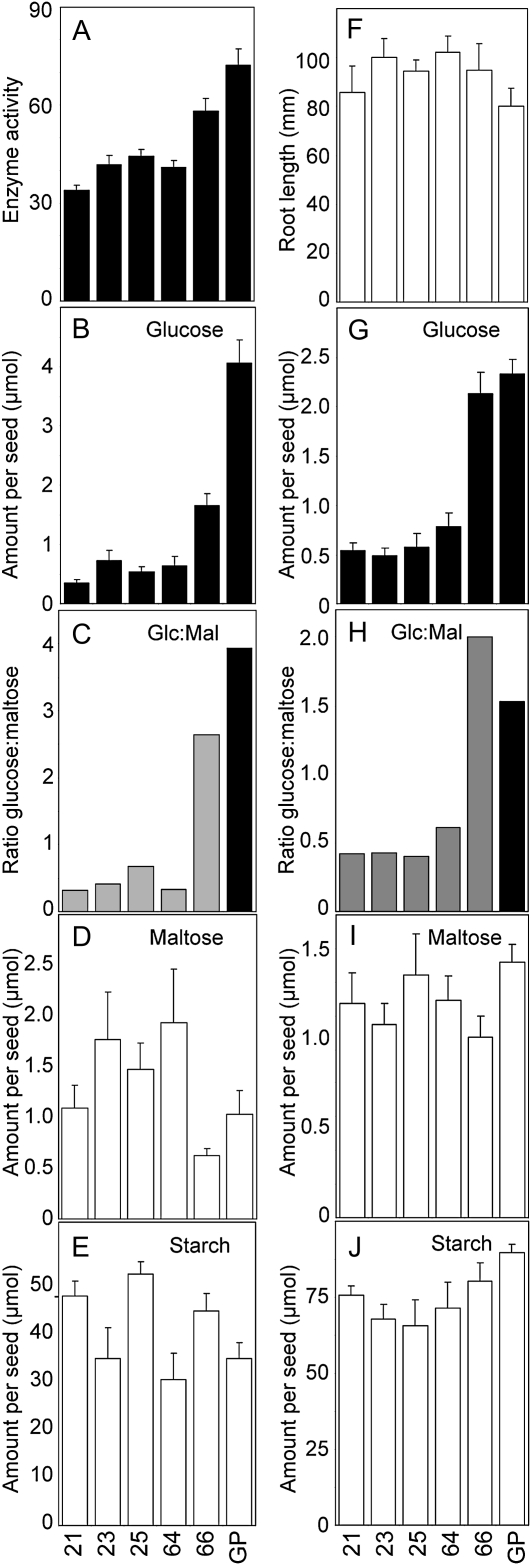
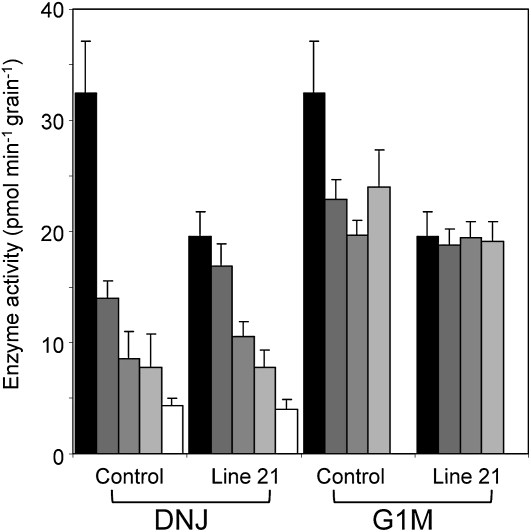
The importance of α-glucosidase in the endosperm starch metabolism of barley (Hordeum vulgare) seedlings is poorly understood. The enzyme converts maltose to glucose (Glc), but in vitro studies indicate that it can also attack starch granules. To discover its role in vivo, we took complementary chemical-genetic and reverse-genetic approaches. We identified iminosugar inhibitors of a recombinant form of an α-glucosidase previously discovered in barley endosperm (ALPHA-GLUCOSIDASE97 [HvAGL97]), and applied four of them to germinating grains. All four decreased the Glc-to-maltose ratio in the endosperm 10 d after imbibition, implying inhibition of maltase activity. Three of the four inhibitors also reduced starch degradation and seedling growth, but the fourth did not affect these parameters. Inhibition of starch degradation was apparently not due to inhibition of amylases. Inhibition of seedling growth was primarily a direct effect of the inhibitors on roots and coleoptiles rather than an indirect effect of the inhibition of endosperm metabolism. It may reflect inhibition of glycoprotein-processing glucosidases in these organs. In transgenic seedlings carrying an RNA interference silencing cassette for HvAgl97, α-glucosidase activity was reduced by up to 50%. There was a large decrease in the Glc-to-maltose ratio in these lines but no effect on starch degradation or seedling growth. Our results suggest that the α-glucosidase HvAGL97 is the major endosperm enzyme catalyzing the conversion of maltose to Glc but is not required for starch degradation. However, the effects of three glucosidase inhibitors on starch degradation in the endosperm indicate the existence of unidentified glucosidase(s) required for this process.


Figures

Figure 1.
Figure 1.
Postimbibition development and metabolite levels in barley seedlings. A, Grains and seedlings at the number of days postimbibition indicated on the photographs. Bars = 0.3 cm for 1- and 3-d images and 1 cm for the remaining images. B, Amounts of starch and metabolites derived from starch in whole seedlings (black squares), endosperm (white circles), and embryos (white squares) during postimbibition growth. Values for starch and soluble glucans are given as μmol Glc equivalents. Values are means ± sd of measurements made on three individual seedlings, endosperms, or embryos. All grains were germinated at the same time in the same conditions.
Figure 2.
Figure 2.
Effects of candidate inhibitors on the activity of recombinant barley grain α-glucosidase. The pure enzyme was assayed using pNPG as a substrate either without inhibitors or in the presence of inhibitors at 10 μm (black bars), 1 μm (dark gray bars), 100 nm (light gray bars), or 10 nm (white bars). The specific activity of the enzyme used in this assay was 25.6 units mg−1. One unit of activity is defined as the amount of enzyme that releases 2 μmol min−1 Glc from maltose when using 15 mm maltose as substrate at 37°C (Naested et al., 2006). The structures and full names of inhibitors are given in Supplemental Figure S1.
Figure 3.
Figure 3.
Effects of inhibitors on root and shoot growth of seedlings. A, Seedlings of cv Optic and Golden Promise were grown for 10 d postimbibition in the absence of inhibitor (water) or in the presence of 500 μm inhibitor. Values for root and coleoptile (shoot) length are means of measurements made on the numbers of seedlings indicated in the top part of the graph. Error bars represent se. B, A seedling of Optic after 7 d of growth in the presence of 500 μm DNJ. An equivalent seedling grown without inhibitor is shown in Figure 1A.
Figure 4.
Figure 4.
Effects of inhibitors on starch, Glc, and maltose levels in seedlings. Seedlings were grown for 10 d postimbibition in the absence of inhibitor (water) or in the presence of 500 μm inhibitor, and amounts of metabolites in the endosperm fraction were assayed. Identical experiments were carried out on grains of cv Optic (A–C) and Golden Promise (D–F). Values marked with asterisks are statistically significantly different from control (water) values (t test; ** P < 0.01, * 0.01 > P < 0.05). A and D, Values for Glc and maltose are means of measurements on the following numbers of individual seedlings. For Optic: water 10, G1M 9, DNJ 8, other inhibitors each 7; for Golden Promise: N-butyl DNJ 4, other inhibitors each 6. Error bars represent se. Values are shown as μmol Glc equivalents. B and E, Values for the ratio of Glc to maltose are calculated from the absolute amounts of these metabolites shown in A and D. C and F, Amounts of starch in seedlings grown in the presence of inhibitors are shown as a proportion of the amounts in seedlings grown in the absence of inhibitor (water). Values are means of measurements on the following numbers of individual seedlings. For Optic: G1M 11, water 10, miglitol 9, DNJ and gal-DNJ 8, N-butyl DNJ 7; for Golden Promise: N-butyl DNJ 3, DNJ 4, water and other inhibitors each 6. Error bars represent se.
Figure 5.
Figure 5.
Effects of inhibitors on starch-hydrolyzing activities in endosperm extracts. A, Extracts of seedlings 3 d after imbibition were subjected to electrophoresis on native, 7.5% acrylamide gels containing 0.1% (w/v) amylopectin. After incubation for 15 min at room temperature, gels were stained with iodine solution and washed to reveal bands attributable to starch-hydrolyzing enzymes. The left gel and the incubation medium contained 500 μm DNJ; the right gel and incubation medium contained no DNJ. Lane 1, No DNJ present during seedling growth or extraction; lane 2, 500 μm DNJ present during seedling growth but not during extraction; lane 3, 500 μm DNJ present during seedling growth and extraction. The two gels were run at the same time and photographed identically. Positions of bands attributable to α- and β-amylases are indicated. Attributions were confirmed by transfer of proteins after electrophoresis to gels containing β-limit dextrins. Bands attributed to α-amylase were visible after incubation, but bands attributed to β-amylase activity were not (data not shown). B, An extract of seedlings 4 d after germination was assayed for α-amylase activity in the presence or absence (none) of 500 μm inhibitor. Values are means of measurements on three technical replicates. Error bars represent se.
Figure 6.
Figure 6.
Effect of inhibitors on root growth of detached embryos supplied with sugars. A, Root length was measured on embryos that had been excised from dry grains and grown in liquid culture with MS medium for 6 d with 500 μm inhibitor or without inhibitor (water) and in the presence or absence (none) of 3% (w/v) sugar. Values are means ± se of measurements on the following numbers of seedlings (left to right for each sugar treatment). None: 10, 6, 4, 4; Glc: 14, 6, 4, 3, 4; Suc: 10, 6, 4, 8, 4; maltose: 14, 6, 3, 4, 4. B, Root lengths for whole seedlings, grown under the same conditions as embryos, in the absence of sugars and in the presence or absence (water) of 500 μm inhibitor. Values are means of measurements on the following numbers of seedlings (left to right): 8, 3, 2, 4, 2. Error bars represent se.
Figure 7.
Figure 7.
Metabolite content and α-glucosidase activity in seedlings from lines of barley transformed with an RNAi construct for α-glucosidase. Ten days after imbibition, seedlings from T1 plants of each of four independent transgenic lines carrying both the silencing and the hygromycin resistance cassettes (lines 21, 23, 25, and 64), one line carrying only the hygromycin resistance cassette (line 66), and the parental cv Golden Promise (GP) were separated into endosperm and embryo fractions. After measurement of root length, the endosperm fraction was frozen and the embryo fraction was used to test for the presence of the hygromycin resistance gene used as the selectable marker. For seedlings carrying the hygromycin gene, activity and metabolite analyses were carried out on the endosperm fraction. Data in A to F were obtained from a single experiment, and data in G to J were obtained in an independent identical experiment. A, α-Glucosidase activity, assayed with pNPG as the substrate. Values are pmol min−1 seedling−1. Values for lines 21, 23, 25, and 64 are statistically significantly different from that for Golden Promise (P = 0.0012, 0.0017, 0.0070, and 0.0004, respectively, by Student’s t test). The value for line 66 is not statistically significantly different from that for Golden Promise (P = 0.0608). B and G, Glc content. C and H, Ratio of Glc to maltose calculated from the absolute amounts of these metabolites shown in B and D and in G and I, respectively. D and I, Maltose content. E and J, Starch content. F, Root length. Starch, Glc, and maltose values are shown as μmol Glc equivalents. Except for E, values are means of measurements on the following number of seedlings (left to right within panels). A, 3, 4, 3, 5, 5, 6; B, D, and E, 4, 5, 5, 3, 5, 6; F, 6, 6, 5, 5, 6, 6; G, I, and J, 5, 5, 5, 6, 7, 8. Error bars represent se.
Figure 8.
Figure 8.
Inhibition of α-glucosidase activity in extracts of transgenic barley seedlings by DNJ and G1M. Seedlings of transgenic line 21 carrying the hygromycin resistance cassette were selected as described for Figure 7. Extracts of the endosperm fraction of individual seedlings of line 21 and Golden Promise, 10 d after imbibition, were assayed for α-glucosidase activity in the absence of inhibitor (black bars) or in the presence of 50 μm, 500 μm, 1 mm, or 5 mm inhibitor (gray and white bars from left to right for each line). Values are means of measurements on six individual seedlings for each line. Error bars represent se.

References

    1. Al Kazaz M, Desseaux V, Marchis-Mouren G, Prodanov E, Santimone M. (1998) The mechanism of porcine pancreatic α-amylase: inhibition of maltopentaose hydrolysis by acarbose, maltose and maltotriose. Eur J Biochem 252: 100–107 - PubMed
    1. Aoki N, Scofield GN, Wang XD, Offler CE, Patrick JW, Furbank RT. (2006) Pathway of sugar transport in germinating wheat seeds. Plant Physiol 141: 1255–1263 - PMC - PubMed
    1. Arai M, Sumida M, Fukuhara K, Kainosho M, Murao S. (1986) Isolation and characterization of amylase inhibitors, (glucose)n·deoxynojirimycin. Agric Biol Chem 50: 639–644
    1. Asano N, Kato A, Kizu H, Matsui K, Watson AA, Nash RJ. (1996) Calystegine B4, a novel trehalase inhibitor from Scopolia japonica. Carbohydr Res 293: 195–204 - PubMed
    1. Bamforth CW. (2009) Current perspectives on the role of enzymes in brewing. J Cereal Sci 50: 353–357

Publication types

LinkOut - more resources