. 2011 Jan;155(1):328-41.
doi: 10.1104/pp.110.166330. Epub 2010 Nov 22.

Callose synthase GSL7 is necessary for normal phloem transport and inflorescence growth in Arabidopsis

Affiliations

Callose synthase GSL7 is necessary for normal phloem transport and inflorescence growth in Arabidopsis

D H Paul Barratt et al. Plant Physiol. 2011 Jan.

Abstract

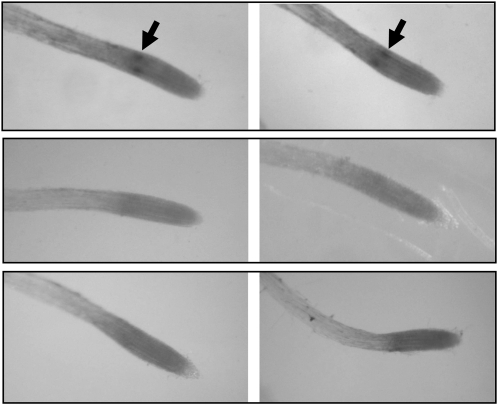
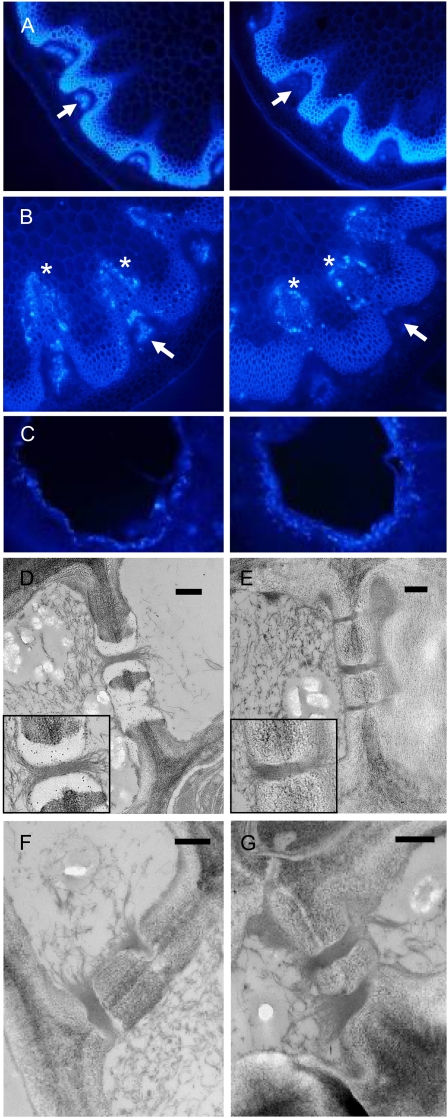
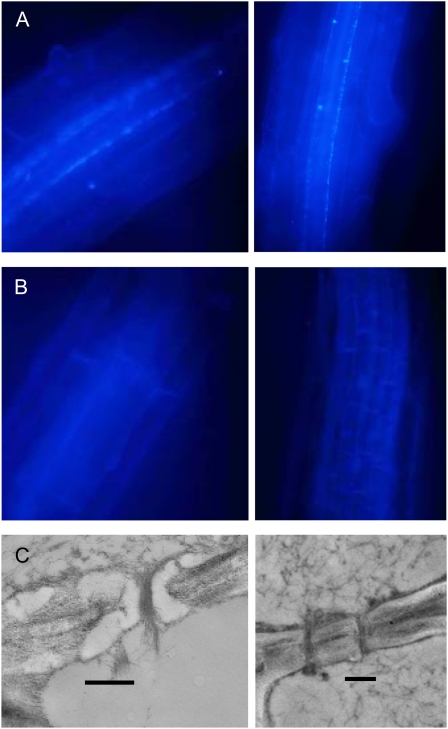
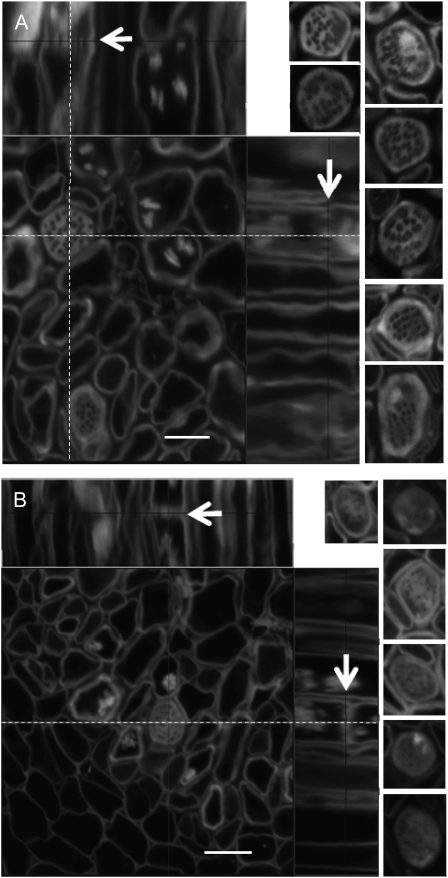
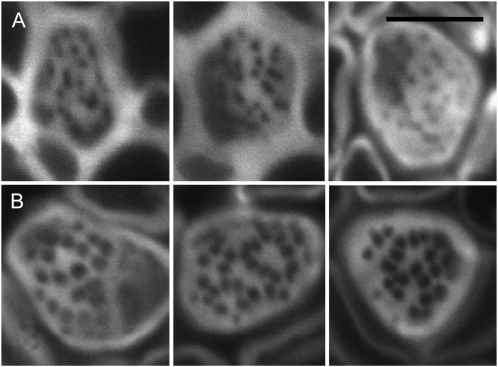
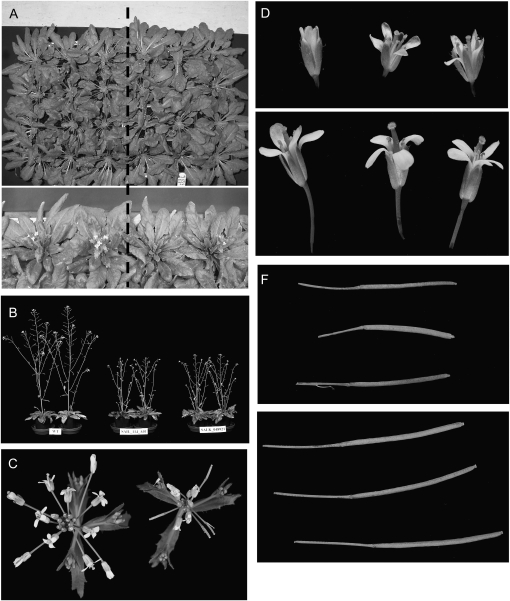
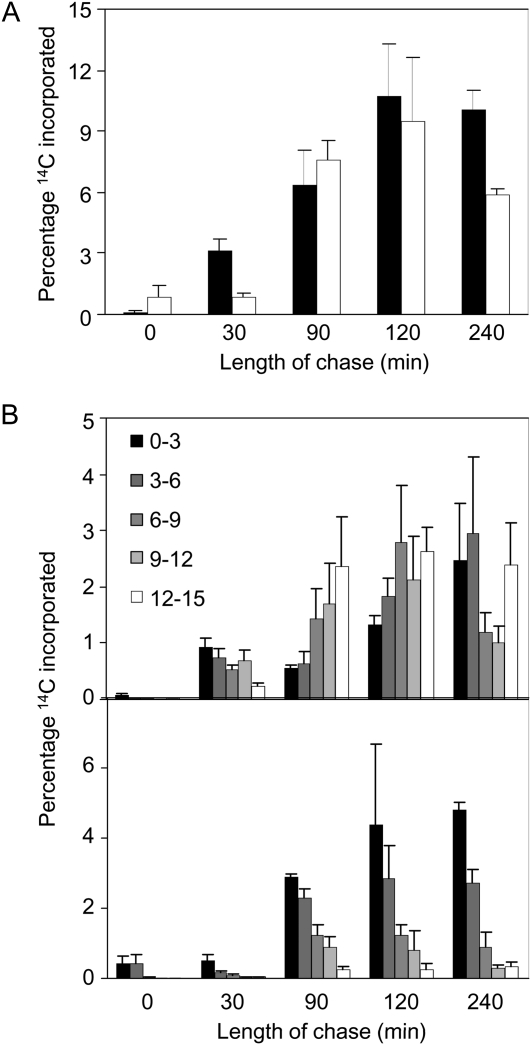
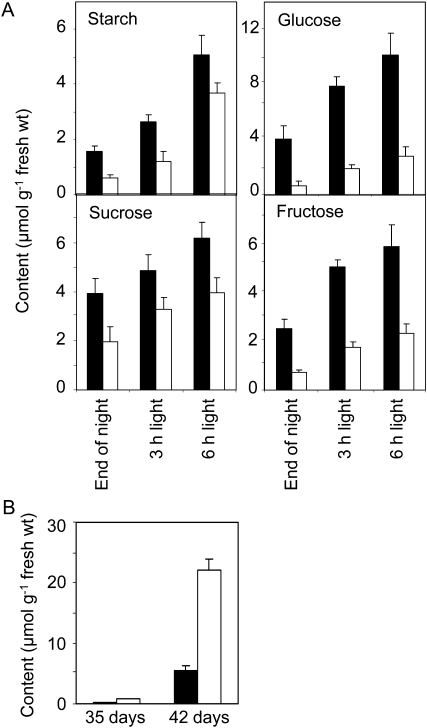
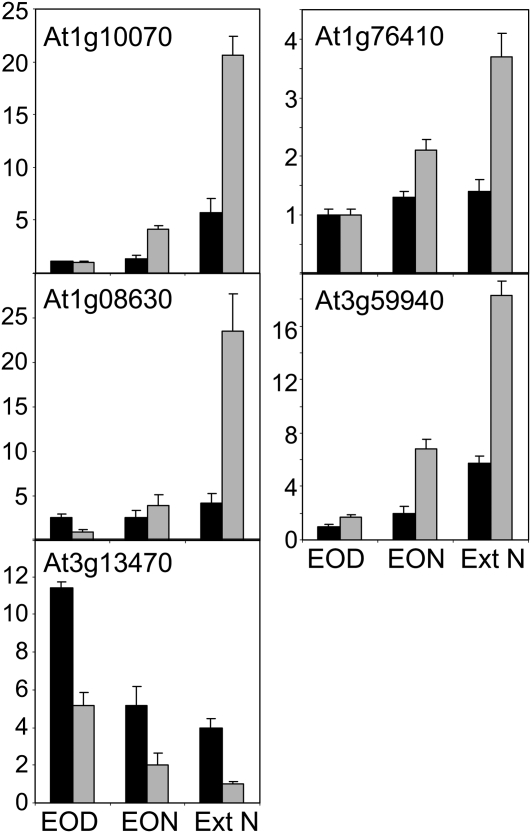
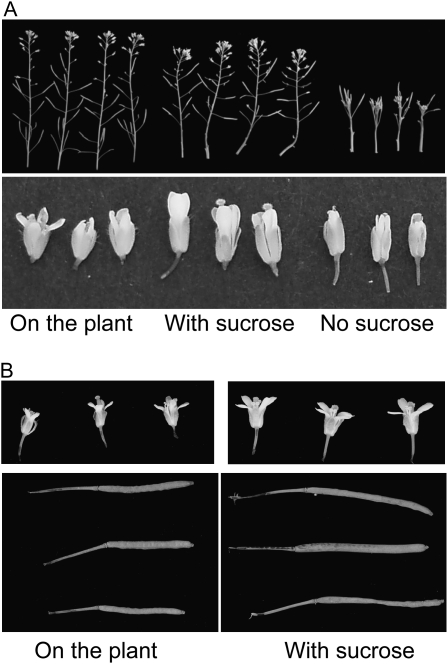
One isoform of callose synthase, Glucan Synthase-Like7 (GSL7), is tightly coexpressed with two isoforms of sucrose synthase (SUS5 and SUS6) known to be confined to phloem sieve elements in Arabidopsis (Arabidopsis thaliana). Investigation of the phenotype of gsl7 mutants of Arabidopsis revealed that the sieve plate pores of stems and roots lack the callose lining seen in wild-type plants. Callose synthesis in other tissues of the plant appears to be unaffected. Although gsl7 plants show only minor phenotypic alterations during vegetative growth, flowering stems are reduced in height and all floral parts are smaller than those of wild-type plants. Several lines of evidence suggest that the reduced growth of the inflorescence is a result of carbohydrate starvation. Levels of sucrose, hexoses, and starch are lower in the terminal bud clusters of gsl7 than in those of wild-type plants. Transcript levels of "starvation" genes expressed in response to low sugars are elevated in the terminal bud clusters of gsl7 plants, at the end of the night, and during an extended night. Pulse-chase experiments with (14)CO(2) show that transport of assimilate in the flowering stem is much slower in gsl7 mutants than in wild-type plants. We suggest that the callose lining of sieve plate pores is essential for normal phloem transport because it confers favorable flow characteristics on the pores.


Figures

Figure 1.
Figure 1.
Location of transcription of the GSL7 gene in roots. Whole-mount preparations of roots were treated with antisense and sense probes from the GSL7 gene. A, Two examples of roots from wild-type plants probed with a 350-bp antisense probe. The arrows indicate two regions of hybridization within the root. B, Two examples of wild-type roots probed with a 350-bp sense probe. C, Two examples of roots from gsl7 mutant plants probed with a 350-bp antisense probe.
Figure 2.
Figure 2.
Loss of callose from the phloem in flowering stems of the gsl7 mutant. All images are representative of results obtained from several different wild-type and gsl7 mutant plants. The cell walls of the xylem and fibers are autofluorescent. A, The basal 1 to 2 cm of flowering stems from 45-d-old plants was excised, and hand-cut sections were stained with aniline blue and viewed with a UV epifluorescence microscope. Left, wild-type plant; right, gsl7 mutant plant. Arrows indicate the position of the phloem. Fluorescence indicating the presence of callose is associated with the phloem in the wild type but not in the gsl7 mutant. B, As in A, but excised stems were incubated in water for 18 h prior to staining. Left, wild-type plant; right, gsl7 mutant plant. Fluorescence indicating the presence of callose is associated with cells adjacent to the xylem in both wild-type and gsl7 mutant stems (asterisks) but is associated with the phloem only in wild-type stems (arrows). C, Fully expanded leaves from 42-d-old plants were punctured with a plastic tip and then harvested the next day, stained with aniline blue, and viewed with a UV epifluorescence microscope. Left, wild-type plant; right, gsl7 mutant plant. D to G, Electron micrographs of phloem elements in sections of the basal 1 to 2 cm of flowering stems from wild-type (D) and gsl7 mutant (E–G) 45-d-old plants excised directly into glutaraldehyde fixative. Sections in D and E are immunogold labeled with an anti-callose antiserum. Note the presence of gold particles in the electron-transparent sieve plate lining of wild-type plants and their absence from an equivalent position in mutant plants (compare enlarged insets in D and E). Bars = 500 nm.
Figure 3.
Figure 3.
Loss of callose from the phloem in roots of the gsl7 mutant. All images are representative of results obtained from several different wild-type and gsl7 mutant plants. Photographs are of roots from 4-d-old seedlings. A and B, Regions behind the expansion zones of roots from two different seedlings stained with aniline blue. In wild-type seedlings (A), fluorescence is associated with two cell files in the stele. In gsl7 seedlings (B), no fluorescence is visible in these cell files. C, Electron micrographs of phloem elements in sections of the proximal region of roots of wild-type (left) and gsl7 mutant (right) seedlings. An electron-transparent lining is present in the sieve plate pores of wild-type but not gsl7 plants. Bars = 500 nm.
Figure 4.
Figure 4.
Sieve plate pores in the base of the stem are small or partially occluded in the gsl7 mutant. Main images are confocal laser scanning micrographs of thick sections from the basal 4 cm of the flowering stems of 6-week-old plants. At this stage, wild-type stems were approximately 13 cm high and gsl7 mutant stems were 10 to 11 cm high (Supplemental Fig. S3). Images were processed using Zeiss LSM Image Browser software. Sieve elements are seen in transverse section and as longitudinal projections (top and right). The dotted lines indicate the positions of the longitudinal sections with respect to the transverse sections. The arrows in the longitudinal sections are positioned at the plane of the transverse section and indicate the same sieve plate. The small images to the left of the main images are typical individual sieve plates seen in transverse sections, taken from independent preparations of stems from three different batches of plants in the wild type and two batches in the case of gsl7 mutant plants. All images are at the same scale. A, The wild type. B, The gsl7 mutant. Note that sieve plate pores are smaller in diameter in all mutant examples than in wild-type examples. Bars = 5 μm.
Figure 5.
Figure 5.
Phloem sieve plates in stems of gsl7 mutant and wild-type plants. Images are taken from the batch of gsl7 mutant plants with the largest sieve plate pores. Pore sizes were smaller in two further independently grown batches of mutant plants (Fig. 4). Images were obtained as described for Figure 4. All images are at the same magnification. A, The gsl7 mutant. B, The wild-type, grown under the same conditions and at the same time as the gsl7 mutant plants shown in A. Bar = 5 μm.
Figure 6.
Figure 6.
Vegetative and reproductive growth of the gsl7 mutant. A, Top, plants after 45 d of growth in 8 h of light and 16 h of dark; bottom, plants after about 35 d of growth in 12 h of light and 12 h of dark. Plants to the left of the dashed line are the wild type, and those to the right are gsl7 mutants grown in the same tray. B, Plants of the wild type (left), gsl7-1 (middle), and gsl7-2 (right) after 49 d of growth in 12 h of light and 12 h of dark. C, Apex of flowering stems after 42 d of growth of wild-type (left) and gsl7 mutant (right) plants photographed from above. Photographs of plants of this age from the side are shown in Supplemental Figure S4. D, Typical flowers from the apex of the flowering stem after 42 d of growth from a gsl7 mutant (top) and a wild-type (bottom) plant. The two images are at the same magnification. E, Fully expanded siliques from flowering stems after 42 d of growth from a gsl7 mutant (top) and a wild-type (bottom) plant. The two images are at the same magnification.
Figure 7.
Figure 7.
Rates of 14C movement in the flowering stem are very different in wild-type and gsl7 mutant plants. A 5-min pulse of 14CO2 was supplied to a mature leaf of plants with flowering stems 15 cm high, and then plants were incubated in normal air for up to 240 min. Plants were harvested immediately after the pulse and at intervals thereafter. 14C was measured in the supplied leaf and in 3-cm sections of the stem, and contents of stem sections are expressed as percentages of the total 14C content (sum of supplied leaf and stem contents). Values are means of measurements on five plants for each time point, and se is indicated. A, Percentage of 14C present in the stem. Black bars, the wild-type; white bars, the gsl7 mutant. B, Percentage of 14C present in successive 3-cm sections of the stem. Section 0 to 3 is the basal section, and section 12 to 15 is the top section. Top graph, wild-type plants; bottom graph, gsl7 mutant plants.
Figure 8.
Figure 8.
Carbohydrate contents of the apices of flowering stems and of leaves of mutant and wild-type plants. Values are means of measurements on five samples per time point, and se is indicated. Black bars, the wild type; white bars, the gsl7 mutant. A, Starch and sugars in apices of flowering stems. Plants were grown for 46 d in 12 h of light and 12 h of dark. Samples were harvested at the end of the night and 3 and 6 h into the light period. Each sample consisted of two flower heads (approximately the apical 1 cm of the main stem, consisting of the terminal cluster of flowers and buds). B, Starch in leaves. Plants were grown for either 35 or 42 d. Each sample was harvested at the end of the night and consisted of three fully expanded leaves from a single plant.
Figure 9.
Figure 9.
Expression of starvation marker genes in the apices of flowering stems of mutant and wild-type plants. Plants were grown for 42 d in 12 h of light and 12 h of dark. Samples were harvested at the end of the night (EON), end of the day (EOD), and after a 4-h extension of the night (Ext N). Each sample consisted of four flower heads (approximately the apical 1 cm of the main stem, consisting of the terminal cluster of flowers and buds). Total RNA was extracted, cDNA was synthesized, and transcript levels were measured by quantitative real-time PCR and normalized against a UBIQUITIN10 control. Details of genes are given in Supplemental Table S4. Values are means of measurements on five samples per time point, and sd is indicated. Black bars, the wild type; gray bars, the gsl7 mutant.
Figure 10.
Figure 10.
Effects of Suc feeding on the inflorescence of the gsl7 mutant. The apical 2 cm of flowering stems of half of a batch of gsl7 plants was harvested when flowering stems were approximately 10 cm in height, and the cut base was incubated in a solution with or without 167 mm Suc. Cultured stems and the remaining intact plants were held in the same environmental conditions for 7 d. A, Inflorescences (top) and flowers (bottom) of intact plants (left), stems cultured with Suc (middle), and stems cultured without Suc (right). B, Flowers (top) and siliques (bottom) from an experiment on a separately grown batch of plants. Left, Organs from intact plants; right, organs from stems cultured with Suc. The two images of flowers are the same magnification, as are the two images of siliques.

References

    1. Amor Y, Haigler CH, Johnson S, Wainscott M, Delmer DP. (1995) A membrane-associated form of sucrose synthase and its potential role in synthesis of cellulose and callose in plants. Proc Natl Acad Sci USA 92: 9353–9357 - PMC - PubMed
    1. Arteca RN, Arteca JM. (2000) A novel method for growing Arabidopsis thaliana plants hydroponically. Physiol Plant 108: 188–193
    1. Barratt DHP, Derbyshire P, Findlay K, Pike M, Wellner N, Lunn J, Feil R, Simpson C, Maule AJ, Smith AM. (2009) Normal growth of Arabidopsis requires cytosolic invertase but not sucrose synthase. Proc Natl Acad Sci USA 106: 13124–13129 - PMC - PubMed
    1. Baud S, Vaultier MN, Rochat C. (2004) Structure and expression profile of the sucrose synthase multigene family in Arabidopsis. J Exp Bot 55: 397–409 - PubMed
    1. Bieniawska Z, Barratt DHP, Garlick AP, Thole V, Kruger NJ, Martin C, Zrenner R, Smith AM. (2007) Analysis of the sucrose synthase gene family in Arabidopsis. Plant J 49: 810–828 - PubMed

Publication types

MeSH terms