

Involvement of Arabidopsis RACK1 in protein translation and its regulation by abscisic acid
- PMID: 21098678
- PMCID: PMC3075769
- DOI: 10.1104/pp.110.160663
Involvement of Arabidopsis RACK1 in protein translation and its regulation by abscisic acid
Abstract
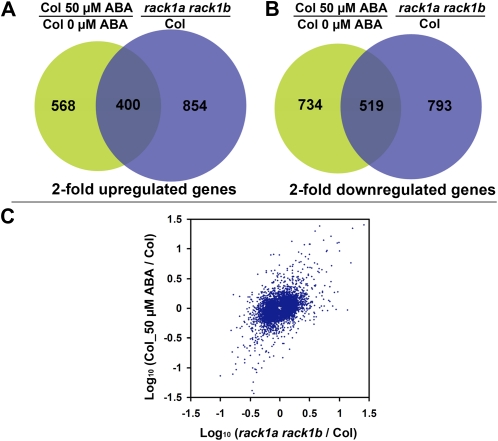
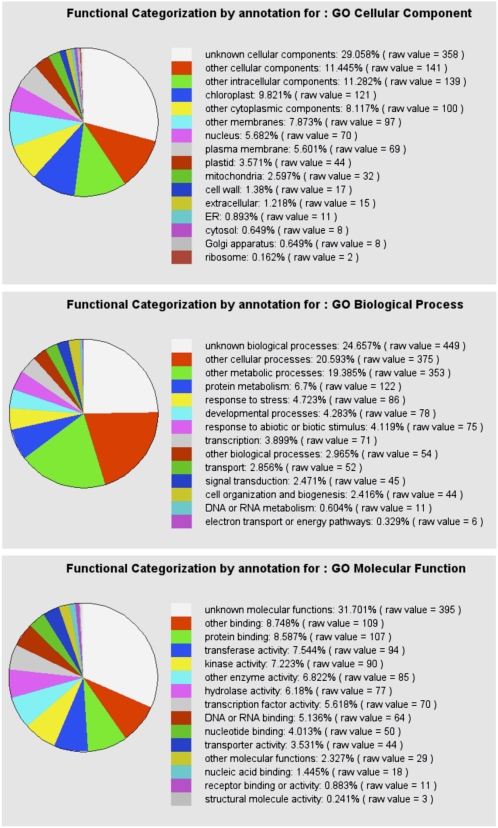
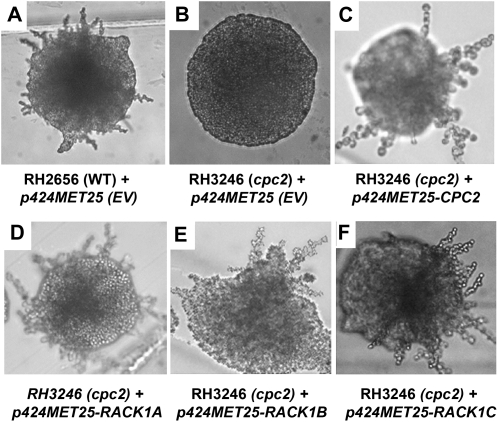
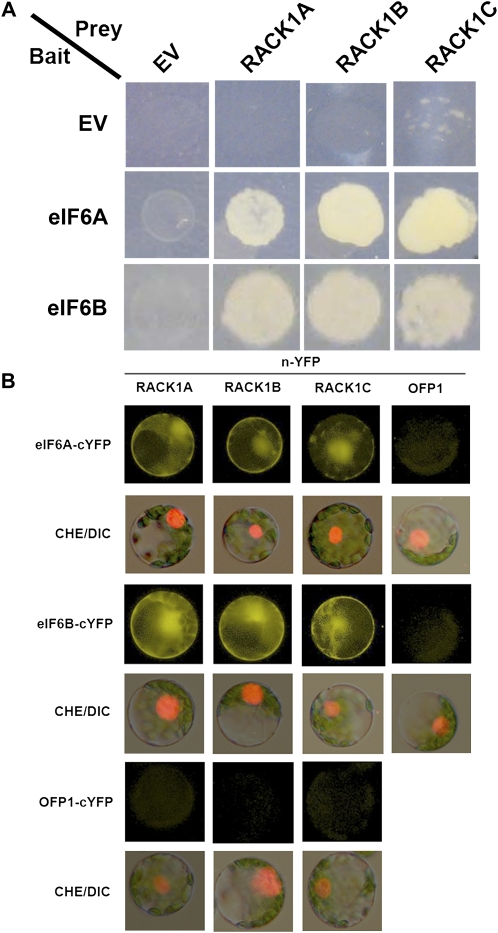
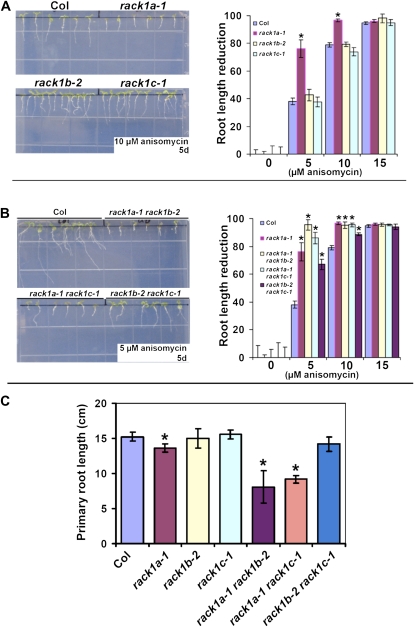
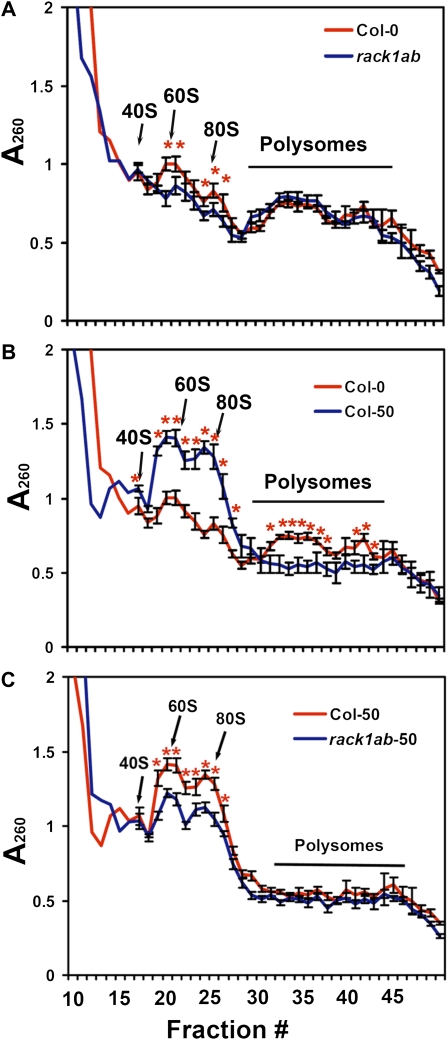
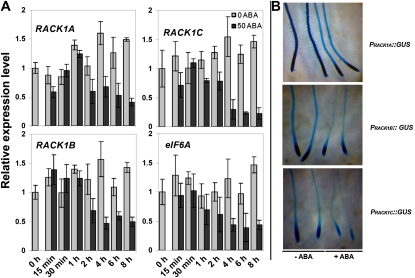
Earlier studies have shown that RACK1 functions as a negative regulator of abscisic acid (ABA) responses in Arabidopsis (Arabidopsis thaliana), but the molecular mechanism of the action of RACK1 in these processes remains elusive. Global gene expression profiling revealed that approximately 40% of the genes affected by ABA treatment were affected in a similar manner by the rack1 mutation, supporting the view that RACK1 is an important regulator of ABA responses. On the other hand, coexpression analysis revealed that more than 80% of the genes coexpressed with RACK1 encode ribosome proteins, implying a close relationship between RACK1's function and the ribosome complex. These results implied that the regulatory role for RACK1 in ABA responses may be partially due to its putative function in protein translation, which is one of the major cellular processes that mammalian and Saccharomyces cerevisiae RACK1 is involved in. Consistently, all three Arabidopsis RACK1 homologous genes, namely RACK1A, RACK1B, and RACK1C, complemented the growth defects of the S. cerevisiae cross pathway control2/rack1 mutant. In addition, RACK1 physically interacts with Arabidopsis Eukaryotic Initiation Factor6 (eIF6), whose mammalian homolog is a key regulator of 80S ribosome assembly. Moreover, rack1 mutants displayed hypersensitivity to anisomycin, an inhibitor of protein translation, and displayed characteristics of impaired 80S functional ribosome assembly and 60S ribosomal subunit biogenesis in a ribosome profiling assay. Gene expression analysis revealed that ABA inhibits the expression of both RACK1 and eIF6. Taken together, these results suggest that RACK1 may be required for normal production of 60S and 80S ribosomes and that its action in these processes may be regulated by ABA.
Figures
Similar articles
-
RACK1 genes regulate plant development with unequal genetic redundancy in Arabidopsis.BMC Plant Biol. 2008 Oct 23;8:108. doi: 10.1186/1471-2229-8-108. BMC Plant Biol. 2008. PMID: 18947417 Free PMC article.
-
RACK1 is a negative regulator of ABA responses in Arabidopsis.J Exp Bot. 2009;60(13):3819-33. doi: 10.1093/jxb/erp221. Epub 2009 Jul 7. J Exp Bot. 2009. PMID: 19584117 Free PMC article.
-
Dissection of the relationship between RACK1 and heterotrimeric G-proteins in Arabidopsis.Plant Cell Physiol. 2009 Sep;50(9):1681-94. doi: 10.1093/pcp/pcp113. Epub 2009 Aug 3. Plant Cell Physiol. 2009. PMID: 19651700
-
Regulation of eukaryotic translation by the RACK1 protein: a platform for signalling molecules on the ribosome.EMBO Rep. 2004 Dec;5(12):1137-41. doi: 10.1038/sj.embor.7400291. EMBO Rep. 2004. PMID: 15577927 Free PMC article. Review.
-
eIF6 anti-association activity is required for ribosome biogenesis, translational control and tumor progression.Biochim Biophys Acta. 2015 Jul;1849(7):830-5. doi: 10.1016/j.bbagrm.2014.09.010. Epub 2014 Sep 22. Biochim Biophys Acta. 2015. PMID: 25252159 Review.
Cited by
-
Recent Advances in the Cellular and Developmental Biology of Phospholipases in Plants.Front Plant Sci. 2019 Apr 5;10:362. doi: 10.3389/fpls.2019.00362. eCollection 2019. Front Plant Sci. 2019. PMID: 31024579 Free PMC article. Review.
-
An Integrated "Multi-Omics" Comparison of Embryo and Endosperm Tissue-Specific Features and Their Impact on Rice Seed Quality.Front Plant Sci. 2017 Nov 22;8:1984. doi: 10.3389/fpls.2017.01984. eCollection 2017. Front Plant Sci. 2017. PMID: 29213276 Free PMC article.
-
Involvement of ABA Responsive SVB Genes in the Regulation of Trichome Formation in Arabidopsis.Int J Mol Sci. 2021 Jun 24;22(13):6790. doi: 10.3390/ijms22136790. Int J Mol Sci. 2021. PMID: 34202673 Free PMC article.
-
Eukaryotic initiation factor 6, an evolutionarily conserved regulator of ribosome biogenesis and protein translation.Plant Signal Behav. 2011 May;6(5):766-71. doi: 10.4161/psb.6.5.15438. Epub 2011 May 1. Plant Signal Behav. 2011. PMID: 21543889 Free PMC article.
-
OsRACK1 is involved in abscisic acid- and H2O2-mediated signaling to regulate seed germination in rice (Oryza sativa, L.).PLoS One. 2014 May 27;9(5):e97120. doi: 10.1371/journal.pone.0097120. eCollection 2014. PLoS One. 2014. PMID: 24865690 Free PMC article.
References
-
- Alonso JM, Stepanova AN, Leisse TJ, Kim CJ, Chen H, Shinn P, Stevenson DK, Zimmerman J, Barajas P, Cheuk R, et al. (2003) Genome-wide insertional mutagenesis of Arabidopsis thaliana. Science 301: 653–657 - PubMed
-
- Aspinall D. (1986) Metabolic effects of water and salinity stress in relation to expansion of the leaf surface. Funct Plant Biol 13: 59–73
Publication types
MeSH terms
Substances
LinkOut - more resources
Full Text Sources
Molecular Biology Databases
