. 2010 Dec 1;70(23):9916-26.
doi: 10.1158/0008-5472.CAN-10-0440. Epub 2010 Nov 23.

p21CIP-1/WAF-1 induction is required to inhibit prostate cancer growth elicited by deficient expression of the Wnt inhibitor Dickkopf-1

Affiliations

p21CIP-1/WAF-1 induction is required to inhibit prostate cancer growth elicited by deficient expression of the Wnt inhibitor Dickkopf-1

Christopher L Hall et al. Cancer Res. .

Abstract

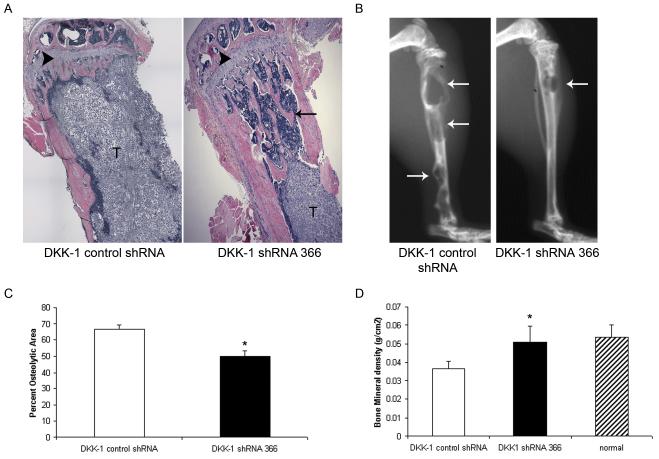
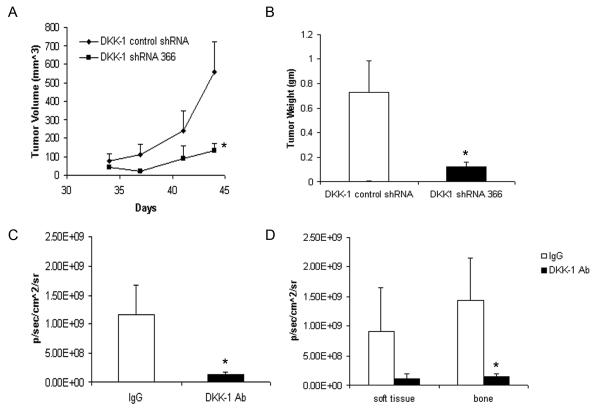
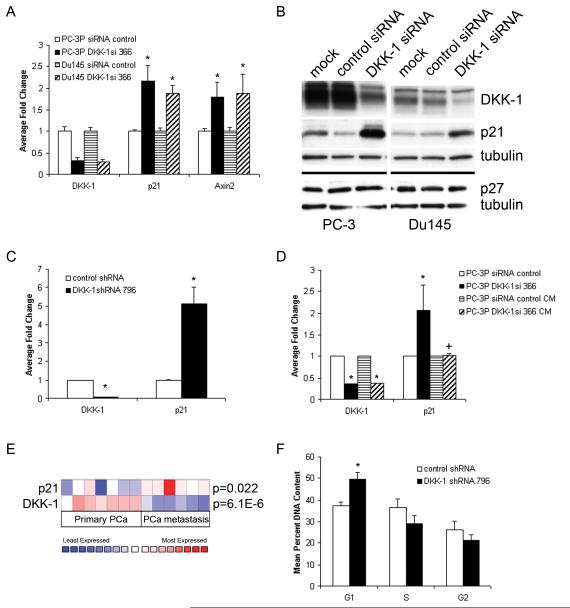
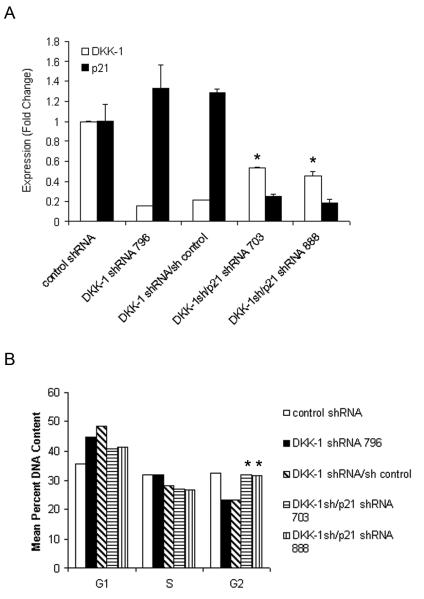
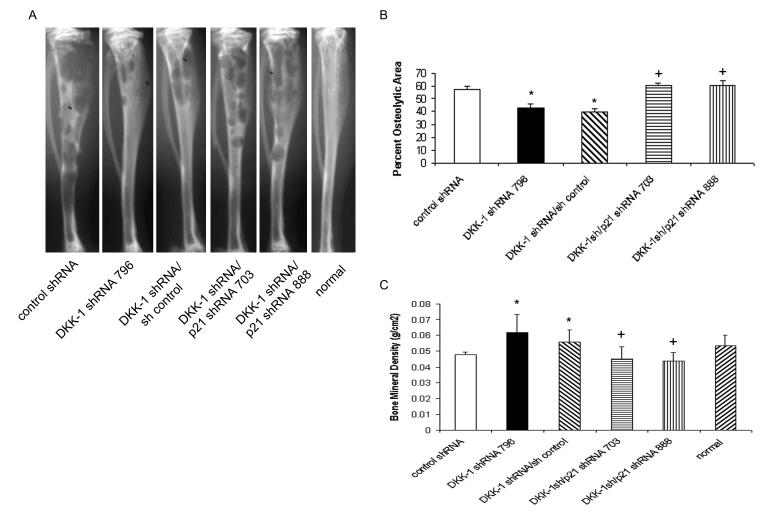
Osteoblastic bone metastases are the most common metastases produced by human prostate cancers (PCa). Deregulated activity of Wnt growth factors resulting from overexpression of the Wnt inhibitor Dickkopf-1 (DKK-1) is known to contribute to formation of the osteoblastic component of PCa skeletal bone metastases. In this study, we report that DKK-1 knockdown in osteolytic human PCa cells unexpectedly delays the development of both soft tissue and osseous lesions. PCa cells deficient in DKK-1 expression did not increase canonical Wnt signaling in target osteoblast cell lines; however, DKK-1 knockdown PCa cells exhibited increased expression of the CDK inhibitor p21(CIP1/WAF1) and a 32% increase in G(1) arrest compared with control cells. Ablating p21(CIP1/WAF1) in PCa cells deficient in DKK-1 was sufficient to rescue tumor growth. Collectively, our findings demonstrate that DKK-1 overexpression supports tumor growth in part by restricting expression of p21(CIP1/WAF1) through a mechanism independent of canonical Wnt signaling.


Figures

Figure 1
Figure 1. Blocking DKK-1 delays PCa establishment within the bone
DKK-1 directed but non-cleaving control shRNA-transfected or DKK-1 shRNA 366-transfected cells (5×10⁵ cells/50 μl) were directly injected into the tibiae of anesthetized male nude mice (10 mice/group). Tumors were allowed to grow for 6 weeks at which time the mice were sacrificed and bones processed for histological evaluation. A) Representative H&E histology of tibiae injected with DKK-1 control shRNA-transfected cells vs. DKK-1 shRNA 366 cells. Normal trabeculae (arrow), marrow (M), tumor (T), and growth plate (arrowhead). Original magnification, 20x. B) Corresponding Faxitron X-rays of tibiae injected with DKK-1 control shRNA cells or DKK-1 shRNA 366-transfected cells. Arrows indicate osteolytic activity. C) Percent osteolytic area of total tibial area. Radiographs from tumor-injected tibiae were digitized and the percent osteolytic area of the total tibial area was quantified. Data are presented as mean±standard error within each group; *p<0.002. vs. PC-3 DKK-1 control shRNA cells by t-test. D) Bones were subjected to DEXA to quantify bone mineral density. Normal tibiae (n=5), tibiae injected with PC-3 DKK-1 control shRNA cells (n=8) or PC-3 DKK-1 shRNA 366-transfected cells (n=10) were scanned. Data are presented as mean±standard error within each group; *p<0.005 compared to PC-3 DKK-1 control shRNA-transfected tibiae by t-test.
Figure 2
Figure 2. Blocking DKK-1 decreases PCa tumor burden in vivo
DKK-1 control shRNA-transfected or DKK-1 shRNA 366-transfected cells (1×10⁶ cells/100 μl) were directly injected into the hind flank of anesthetized male nude mice. A) Tumor diameter was measured in two axes using a caliper twice a week and tumor volume calculated. Shown is the tumor volume over time of DKK-1 control shRNA-transfected or DKK-1 shRNA 366-transfected cells; mean±standard error of subcutaneous tumors. *p<0.006 vs. DKK-1 control shRNA cells by a repeat measures generalized linear model. B) Subcutaneous tumor weight at experimental endpoint. After 6 weeks, the subcutaneous tumors were excised and weighed. Shown is the mean±standard error of subcutaneous tumors; *p<0.003 vs. DKK-1 control shRNA cells by t-test. C-D. DKK-1 neutralizing antibody: Beginning at Day 0, male Nu/Nu mice were injected with 5 mg/kg IgG isotype control or DKK-1 neutralizing antibody (I.P.) twice a week for seven total weeks. At Day 7, DKK-1+ PC-3 luciferase cells were injected into the left cardiac ventricle (2×10⁵ cells/0.1 ml) to establish bone metastases. C) Total tumor burden was measured using bioluminescent imaging following the injection of luciferin. The data are presented as mean number of photons/sec/cm2 (± the standard error), 10 mice/group. *p<0.028 compared to IgG control mice by t-test. D) Tumor burden in soft tissue or bone lesions within each treatment group; *p<0.02 compared to IgG control mice by t-test.
Figure 3
Figure 3. DKK-1 knock-down increases p21 expression and G1 arrest
Parental PC-3 and Du145 PCa cells were transiently transfected with a control siRNA oligo or a DKK-1 366 targeting siRNA. After 48 hours, cells were lysed for both RNA and protein isolation. A) RT quantitative-PCR analysis of transfected cells for DKK-1, p21, or axin-2, mean±standard deviation of four experiments; *p<0.01 compared to control siRNA cells by t-test. B) Corresponding western blot of transfected cells. Membranes were blotted with antisera specific to DKK-1, p21, p27 or, as a control for loading, α-tubulin. C) RT-quantitative PCR analysis of DKK-1 and p21 expression in stable pools of DKK-1 shRNA 796-transduced cells. Shown is the fold change vs. control shRNA-transduced cells, mean±standard error of duplicate experiments; *p<0.004 vs. control shRNA cells by t-test. D) RT-quantitative PCR analysis of DKK-1 and p21 expression in PC-3 DKK-1 siRNA 366 or control siRNA-transfected cells treated with 72 hour PC-3 conditioned medium. Shown is the fold change vs. control shRNA-transduced cells, mean±standard deviation of duplicate experiments; *p<0.05 vs. control siRNA cells by t-test. E) The Oncomine cDNA microarray database was evaluated for p21 expression in human PCa tumor samples where DKK-1 was found to be decreased. Shown is a study comparing clinical cases of primary PCa vs. PCa metastases. F) Cell cycle analysis. Equal number of DKK-1 shRNA 796-transduced or control shRNA-transduced cells (5×10⁵ cells) were plated at Day 0 and the percent DNA content was measured at Day 2 by flow cytometry following staining with Propidium Iodide. Shown is the mean percent DNA content, mean±standard error of three experiments; *p<0.01 vs. control shRNA cells by t-test.
Figure 4
Figure 4. Characterization of DKK-1/p21 double knock-down cells
PC-3 DKK-1 shRNA 796 cells were transduced with a control shRNA or two shRNA specific to p21. A) RT quantitative-PCR analysis of transduced cells for DKK-1 or p21, mean±standard deviation of a representative experiment; *p<0.003 vs. control shRNA cells by t-test. B) Cell cycle analysis. Equal number of cells (5×10⁵ cells) were plated at Day 0 and the percent DNA content was measured using flow cytometry at Day 2 following staining with Propidium Iodide; *p<0.0001 vs. DKK-1 shRNA cells by t-test.
Figure 5
Figure 5. Knock-down of p21 restores in vivo tumorigenicity of DKK-1 knock-down cells
Control shRNA-transduced, DKK-1 shRNA 796-transduced, DKK-1 shRNA 796/control shRNA-transduced, or DKK-1 shRNA 796-transduced/p21shRNA-transduced cells (5×10⁵ cells/50 μl) were directly injected into the tibiae of anesthetized male nude mice (10 mice/group). Tumors were allowed to grow for 3 weeks at which time the mice were sacrificed and bones radiographed and processed for histological evaluation. A) Representative Faxitron X-rays of injected tibia. B) Percent osteolytic area of total tibial area. Radiographs from tumor-injected tibiae were digitized and the percent osteolytic area of the total tibial area was quantified. Data are presented as mean±standard error within each group; *p<0.003 vs. PC-3 control shRNA cells; +p<0.002 vs. PC-3 DKK-1 shRNA 796 cells by t-test. C) Bones were subjected to DEXA to quantify bone mineral density. Data are presented as mean±standard error within each group; *p<0.01 compared to control shRNA-transduced tibiae; +p<0.001 vs. PC-3 DKK-1 shRNA 796-transduced tibiae by t-test.

Similar articles

Cited by

References

    1. Keller ET, Zhang J, Cooper CR, et al. Prostate carcinoma skeletal metastases: cross-talk between tumor and bone. Cancer Metastasis Rev. 2001;20:333–49. - PubMed
    1. Bubendorf L, Schopfer A, Wagner U, et al. Metastatic patterns of prostate cancer: an autopsy study of 1,589 patients. Hum Pathol. 2000;31:578–83. - PubMed
    1. Roudier MP, Corey E, True LD, et al. Histological, immunophenotypic and histomorphometric characterization of prostate cancer bone metastases. Cancer Treat Res. 2004;118:311–39. - PubMed
    1. Logothetis CJ, Lin SH. Osteoblasts in prostate cancer metastasis to bone. Nat Rev Cancer. 2005;5:21–8. - PubMed
    1. Hall CL, Bafico A, Dai J, Aaronson SA, Keller ET. Prostate cancer cells promote osteoblastic bone metastases through Wnts. Cancer Res. 2005;65:7554–60. - PubMed

Publication types

MeSH terms

Substances