. 2010 Nov;22(11):3864-76.
doi: 10.1105/tpc.110.078964. Epub 2010 Nov 23.

Rice xa13 recessive resistance to bacterial blight is defeated by induction of the disease susceptibility gene Os-11N3

Affiliations

Rice xa13 recessive resistance to bacterial blight is defeated by induction of the disease susceptibility gene Os-11N3

Ginny Antony et al. Plant Cell. 2010 Nov.

Abstract

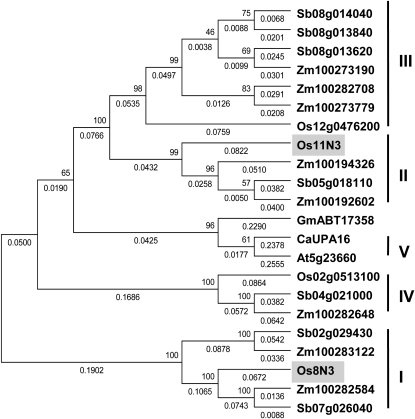
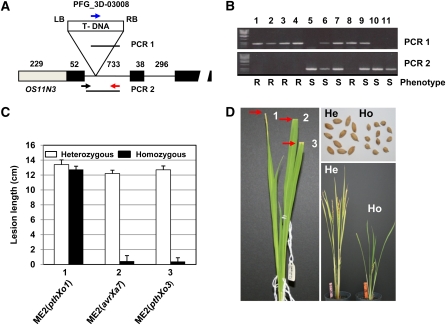
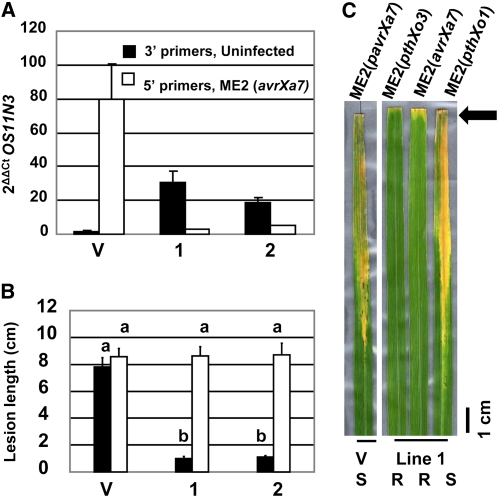
The rice (Oryza sativa) gene xa13 is a recessive resistance allele of Os-8N3, a member of the NODULIN3 (N3) gene family, located on rice chromosome 8. Os-8N3 is a susceptibility (S) gene for Xanthomonas oryzae pv oryzae, the causal agent of bacterial blight, and the recessive allele is defeated by strains of the pathogen producing any one of the type III effectors AvrXa7, PthXo2, or PthXo3, which are all members of the transcription activator-like (TAL) effector family. Both AvrXa7 and PthXo3 induce the expression of a second member of the N3 gene family, here named Os-11N3. Insertional mutagenesis or RNA-mediated silencing of Os-11N3 resulted in plants with loss of susceptibility specifically to strains of X. oryzae pv oryzae dependent on AvrXa7 or PthXo3 for virulence. We further show that AvrXa7 drives expression of Os-11N3 and that AvrXa7 interacts and binds specifically to an effector binding element within the Os-11N3 promoter, lending support to the predictive models for TAL effector binding specificity. The result indicates that variations in the TAL effector repetitive domains are driven by selection to overcome both dominant and recessive forms of resistance to bacterial blight in rice. The finding that Os-8N3 and Os-11N3 encode closely related proteins also provides evidence that N3 proteins have a specific function in facilitating bacterial blight disease.


Figures

Figure 1.
Figure 1.
Major TAL Effector Genes Defeat xa13 in Rice without Induction of Os-8N3. (A) Disease leaf lesions on 10 28-d-old plants of cultivars IRBB13 (black bars) and IR24 (white bars) were measured 14 d after inoculation at the leaf tips with bacterial suspensions (0.5 × 10⁸ colony-forming units/mL) of the following strain treatments: 1, ME2 (pHM1); 2, ME2 (pthXo1); 3, ME2 (pthXo2); 4, ME2 (pthXo3); 5, ME2 (avrXa7). Values with the same lowercase letters above columns do not differ significantly at the <0.5 level using Tukey statistic and ANOVA analysis. Bars indicate 1 sd. (B) qRT-PCR measurements of Os-8N3 expression following strain treatments as for (A). RNA was prepared 24 h after inoculation of leaves, and qRT-PCR was performed using gene-specific primers for rice locus Os-8N3. Values are normalized against the expression of the rice gene TFIIAγ5 (NM 001060961). RNA gel blot hybridization analysis of Os-8N3 following bacterial inoculation is shown below the qRT-PCR data for each treatment. Total RNA was prepared from 10 leaves of rice cultivars IRBB13 and IR24 and measured spectrophotometrically. Equal amounts from each treatment were loaded in an agarose gel, fractionated, and subjected to hybridization analysis using 32P-labeled fragment of Os-8N3.
Figure 2.
Figure 2.
PthXo3 and AvrXa7 Induce Os-11N3. (A) qRT-PCR analysis of Os-11N3 expression from RNA prepared 24 h after inoculation of leaves of cultivar Nipponbare using gene-specific primers for rice locus Os11g31990 (Os-11N3). Strains used in each inoculation are indicated below each lane. TFIIAγ5 expression was used as an internal control for the quantity and quality of RNA sample. Strains for each treatment were as follows: 1, water; 2, ME7; 3, ME2(pHM1); 4, ME2 (pthXo1); 5, ME2(pthXo2); 6, ME2(pthXo3); 7, ME2(avrXa7). RNA was extracted 24 h after inoculation. Error bars indicate 1 sd. (B) Schematic of cDNA AK101913 corresponding to Os-11N3 aligned with genomic sequence. Numbers indicate the bases in the indicated region.
Figure 3.
Figure 3.
Rice Os-11N3 Represents a Distinct Clade of the N3 Family. Alignment and phylogenetic analyses were conducted using ClustalW (Thompson et al., 1994) and the Minimal Evolution program in MEGA version 4 for unrooted phylogeny tree construction (Tamura et al., 2007). Bootstrap support for 1000 reiterations is provided above each line.
Figure 4.
Figure 4.
A T-DNA Insertion in Os-11N3 Confers AvrXa7- and PthXo3-Specific Recessive Resistance. (A) Position of T-DNA insertion PFG_3D-03008 within the first intron of Os-11N3. Schematic is not to scale. PCR product across the right border (RB) of insertion is indicated by blue and red arrows (PCR1). PCR product of the wild-type locus is indicated by the black and red arrows (PCR2). LB, left border. (B) PCR analysis of progeny of rice cultivar Hwayoung with T-DNA insertion PFG_3D-03008. Homozygous mutant progeny are indicated by presence of fragment in the top panel (PCR1) and absence of fragment in the bottom panel (PCR2). The presence of both fragments is indicative of a heterozygous individual. The absence of PCR1 is indicative of a homozygous wild-type locus. The template for sample in lane 11 was prepared from the parent line Hwayoung. The phenotype of the line whose genotype is shown is indicated below lanes. R, resistant to infection by ME2(avrXa7) and ME2(pthXo3); S, susceptible to infection by ME2(avrXa7) and ME2(pthXo3). (C) Average lesion length measurements of six heterozygous (white) and six homozygous plants (black) after inoculation with (1) ME2(pthXo1), (2) ME2(avrXa7), or (3) ME2(pthXo3). Error bars indicate 1 sd. (D) Phenotypes of homozygous T-DNA insertion mutant inoculated with the following strains: leaf 1, ME2(pthXo1), leaf 2, ME2(avrXa7); and leaf 3, ME2(pthXo3). Phenotype of a homozygous T-DNA insertion mutant (plant 10-3, genotype analysis in [B], lane 8) after inoculation with the following strains: leaf 1, ME2(pthXo1); leaf 2, ME2(avrXa7); and leaf 3, ME2(pthXo3). Panel at left shows leaves on intact 50-d-old plant. Red arrows indicate sites of inoculation. Phenotypic differences in seed sizes are shown in the top right panel: He, heterozygous plant; Ho, homozygous mutant plant. The bottom right panel shows stature comparison of 90-d-old heterozygous and homozygous mutant individuals.
Figure 5.
Figure 5.
RNAi Knockdown of Os-11N3 Provides AvrXa7- and PthXo3-Specific Resistance. (A) qPCR analysis of two transgenic rice lines (1 and 2) expressing a portion of the Os-11N3 3′-UTR as a double-stranded RNA. A control line was also examined containing only the vector T-DNA sequences (V). RNA was prepared from plants generated without the insert (column V, vector alone) and two transgenic lines with the insert (columns 1 and 2). Black columns indicate analysis of RNA from uninfected plants, and expression of sequences from the overexpressed double-stranded Os-11N3 3′-UTR was amplified using 3′-specific primers. White columns indicate analysis of Os-11N3 5′-UTR region 24 h after inoculation of the same lines with ME2(avrXa7). (B) Lesion lengths were measured 9 d after inoculation of lines V, 1, and 2 with ME2(pthXo1) (white) or ME2(avrXa7) (black). Measurements are averages of 10 plants. Values with same letter do not differ significantly at the P < 0.5 level using the Tukey statistic following ANOVA analysis. Error bars indicate 1 sd. (C) Phenotypes of progeny of RNAi line 1 challenged with ME2(pthXo1), ME2(pthXo3), or ME2(avrXa7). Line V, containing only vector sequences, is shown after inoculation with ME2(avrXa7). S, susceptible; R, resistant. Arrow indicates site of inoculation. Plants were photographed 9 d after inoculation.
Figure 6.
Figure 6.
Candidate Effector Binding Elements in the Promoters of Os-8N3 and Os-11N3. (A) The predicted effector binding element of PthXo1, AvrXa7, and PthXo3 aligned with the corresponding two amino acid variables in the respective repeat region. 1° and 2° denote primary and secondary possible nucleotides as specified by the two amino acid variable residues of the respective repeats. Consensus nucleotides are indicated by the single letter code: N, A, C, G, or T. n, unassigned. (B) The promoter region of Os-8N3 (−397 to +3) from cultivar Nipponbare is shown. Predicted PthXo1 binding element is underlined, and the site of insertion in IRBB13 is indicated by a triangle next to the first nucleotide of the EBE. The start site for normal transcription A is indicated in large bold font immediately downstream of the TATA box. (C) Os-11N3 promoter sequence (−336 to +3) from cultivar Nipponbare with AvrXa7 and PthXo3 binding elements underlined. The start sites for normal transcription (A) and the alternate transcription in the presence of AvrXa7 (G) are indicated in large bold font.
Figure 7.
Figure 7.
AvrXa7 Drives TAL Effector-Specific Host Gene Induction. (A) Promoter fragments used in the transient expression assay. The consensus effector binding elements are underlined. The nonconsensus changes introduced in the mutant versions are in lowercase letters. Os-8N3pBB13 contains the insertion/deletion of xa13 allele in IRBB13, and sequence is not shown. The first 10 (Os-11N3) or 12 (Os-8N3) bases upstream of the EBE and between the EBE region and the ATG are not shown. Each fragment was fused to the ATG of the uidA coding sequence. (B) GUS assay on N. benthamiana using 35S-avrXa7 (left sites) or 35S-pthXo1 (right sites). Sites are stained with X-gluc. Coinoculations with 35S-pthXo3 and combinations with promoter fragment Os-8N3pBB13 (7) are not shown. The T-DNA vector containing 35S-avrXa7 or 35S-pthXo1 alone was infiltrated at sites indicated with an asterisk. (C) Average GUS activity was calculated from triplicate coinoculations of the promoter fragments in (A) with 35S-pthXo1, 35S-avrXa7, or 35S-pthXo3. The numbers for each treatment with the indicated plant-expressed effector corresponds to the promoter fragments in (A). Average GUS activity was measured from three excised leaf disks with hybrid promoters as indicated in (A) coinfiltrated with 35S-pthXo1 (black columns), 35S-avrXa7 (gray columns), or 35S-pthXo3 (white). Activity on MUG substrate is expressed as pmol of 4-methylumbelliferone (4-MU) per μg of protein.
Figure 8.
Figure 8.
AvrXa7 Interacts with the Os-11N3 Promoter. (A) Oligonucleotides used in EMS assays. The predicted effector binding elements within the respective promoters are underlined. The nucleotide changes in the mutant version Os-11N3οM2 are in lowercase. (B) The oligonucleotides for EMSA (shown in [A]) were incubated with 6His-AvrXa7. “+” or “–” indicates the presence or absence of the AvrXa7 or the oligonucleotides included in the reaction for each lane. (C) Competition assay with increasing amounts of unlabeled Os-11N3οWT or Os-11N3οM2.
Figure 9.
Figure 9.
AvrXa7 Interacts with the Os-11N3 Promoter in Rice. (A) Immunoblot analysis of AvrXa7-2F and PthXo1-2F protein expression, inferred from M2 FLAG monoclonal antibody recognition of internal double FLAG epitopes in bacterial strains carrying FLAG-tagged AvrXa7-2F and PthXo1-2F. Analysis of protein from two colonies is shown. Coomassie blue–stained gel is shown at right. M, protein molecular size standards. Numbers at left indicate kilodaltons. Lanes: ME2 (pHM1); 2, ME2(avrXa7-2F-1); 3, ME2(avrXa7-2F-2); 4, ME2(pthXo1-2F-1); 5, ME2(pthXo1-2F-2). (B) FLAG-tagged versions of AvrXa7 and PthXo1 induce the respective S gene when produced in ME2. Induction was measured in 2ΔΔCt. Three 14-d-old rice seedlings were inoculated with the indicated strain, and total RNA was isolated from three leaves and subjected to qRT-PCR. (C) avrXa7-2F and pthXo1-2F confer virulence on ME2. Four-week-old rice plants were inoculated with the respective strains (indicated below each column) by leaf tip clipping inoculation. Lesion lengths were measured 12 d after inoculation on 10 inoculated leaves for each treatment. Error bars indicate 1 sd. (D) qPCR analysis of AvrXa7-2F (first three columns) and PthXo1-2F (fourth column) immunoprecipitated complexes from leaf infection sites using primers for the indicated DNA fragment. Fold changes in average cycle numbers were compared with average cycle numbers of the same PCR products in complexes immunoprecipitated with IgG control antibodies. The values are the averages of three independent leaf inoculations with the exception of the fourth column, which is the average of two inoculations. Values that do not differ significantly at P < 0.05 level are indicated by the same lowercase letter. Significance was determined using ANOVA and the Tukey HSD test (F-statistic, 13.68, P = 0.0026). Error bars indicate 1 sd.

References

    1. Boch J., Scholze H., Schornack S., Landgraf A., Hahn S., Kay S., Lahaye T., Nickstadt A., Bonas U. (2009). Breaking the code of DNA binding specificity of TAL-type III effectors. Science 326: 1509–1512 - PubMed
    1. Chen L., et al. (2010). Sugar transporters for intercellular exchange and nutrition of pathogens. Nature 468: 527–532 - PMC - PubMed
    1. Chisholm S.T., Coaker G., Day B., Staskawicz B.J. (2006). Host-microbe interactions: Shaping the evolution of the plant immune response. Cell 124: 803–814 - PubMed
    1. Chu C.G., Faris J.D., Xu S.S., Friesen T.L. (2010). Genetic analysis of disease susceptibility contributed by the compatible Tsn1-SnToxA and Snn1-SnTox1 interactions in the wheat-Stagonospora nodorum pathosystem. Theor. Appl. Genet. 120: 1451–1459 - PubMed
    1. Chu Z., Yuan M., Yao J., Ge X., Yuan B., Xu C., Li X., Fu B., Li Z., Bennetzen J.L., Zhang Q., Wang S. (2006). Promoter mutations of an essential gene for pollen development result in disease resistance in rice. Genes Dev. 20: 1250–1255 - PMC - PubMed

Publication types

MeSH terms

Associated data

LinkOut - more resources