. 2010 Dec;120(12):4558-68.
doi: 10.1172/JCI42945. Epub 2010 Nov 22.

Pathogenic T cells have a paradoxical protective effect in murine autoimmune diabetes by boosting Tregs

Affiliations

Pathogenic T cells have a paradoxical protective effect in murine autoimmune diabetes by boosting Tregs

Yenkel Grinberg-Bleyer et al. J Clin Invest. 2010 Dec.

Abstract

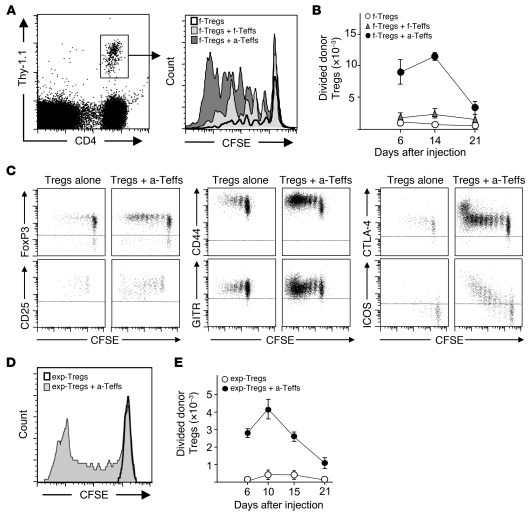
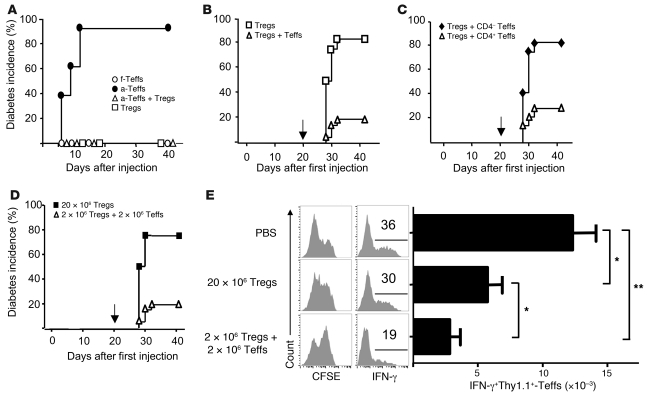
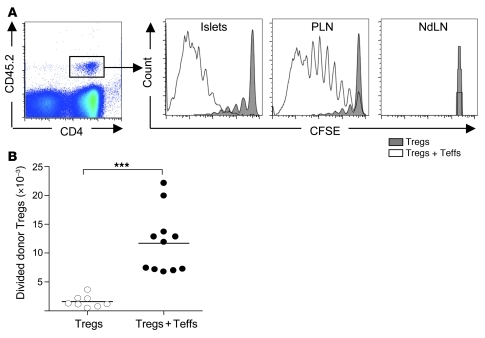
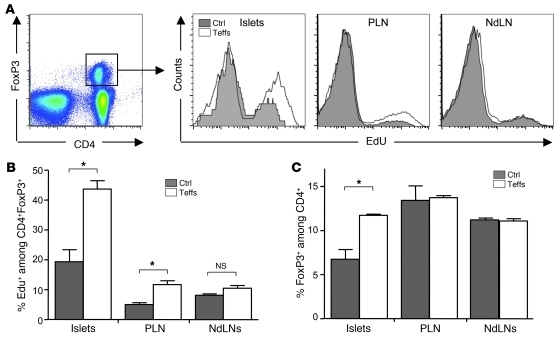
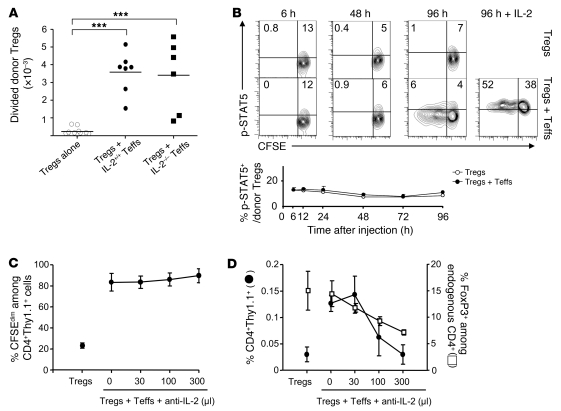
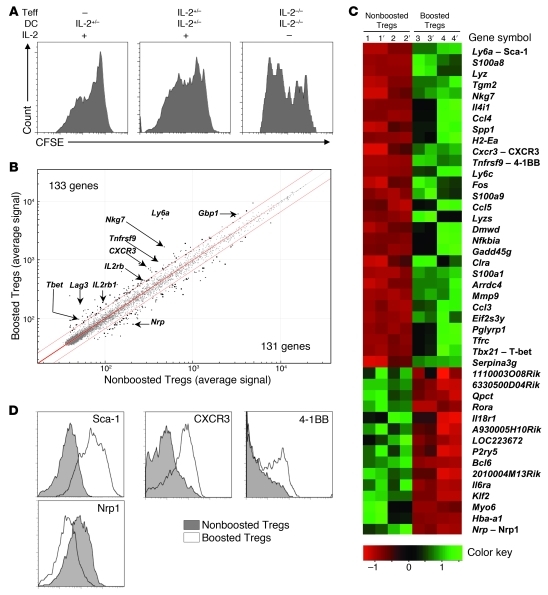
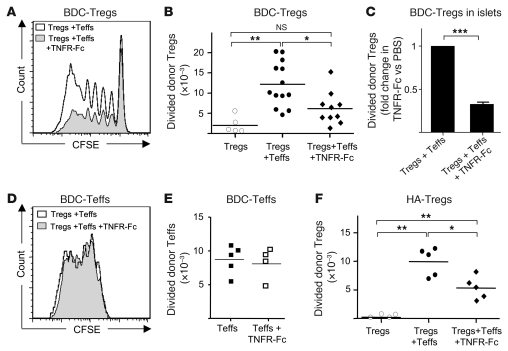
CD4+CD25+Foxp3+ Tregs play a major role in prevention of autoimmune diseases. The suppressive effect of Tregs on effector T cells (Teffs), the cells that can mediate autoimmunity, has been extensively studied. However, the in vivo impact of Teff activation on Tregs during autoimmunity has not been explored. In this study, we have shown that CD4+ Teff activation strongly boosts the expansion and suppressive activity of Tregs. This helper function of CD4+ T cells, which we believe to be novel, was observed in the pancreas and draining lymph nodes in mouse recipients of islet-specific Teffs and Tregs. Its physiological impact was assessed in autoimmune diabetes. When islet-specific Teffs were transferred alone, they induced diabetes. Paradoxically, when the same Teffs were cotransferred with islet-specific Tregs, they induced disease protection by boosting Treg expansion and suppressive function. RNA microarray analyses suggested that TNF family members were involved in the Teff-mediated Treg boost. In vivo experiments showed that this Treg boost was partially dependent on TNF but not on IL-2. This feedback regulatory loop between Teffs and Tregs may be critical to preventing or limiting the development of autoimmune diseases.


Figures

Figure 1
Figure 1. Islet-specific Teffs strongly boost the activation of islet-specific Tregs.
(AC) Ins-HA mice were injected with CFSE-labeled Thy-1.1+ freshly purified HA-Tregs alone (f-Tregs) or were cotransferred with freshly purified HA-Teffs (f-Tregs + f-Teffs) or preactivated HA-Teffs (f-Tregs + a-Teffs). (A) Representative CFSE profile of donor Tregs (gated on CD4+Thy-1.1+ cells as shown in the left panel) in PLNs 14 days after cell injection. (B) Absolute number of divided donor Tregs (CFSEdimCD4+Thy-1.1+ cells) were quantified in PLNs at 6, 14, and 21 days after cell transfer. The graph shows mean data from 3 to 8 mice per time point pooled from 4 independent experiments. (C) Representative expression of the indicated proteins on donor Tregs in PLNs 7 days after cell injection. Plots, gated on CD4+Thy-1.1+ cells (for FoxP3) or CD4+Thy-1.1+FoxP3+ cells (for the other markers), are representative of 2 to 5 independent experiments. Horizontal dashed lines delineate positive staining. (D and E) Ins-HA mice were injected with CFSE-labeled Thy-1.1+ expanded HA-Tregs alone (exp-Tregs) or were cotransferred with preactivated HA-Teffs (exp-Treg + a-Teffs). (D) Representative CFSE profile of donor Tregs in PLNs 10 days after cell injection. (E) Absolute numbers of divided donor Tregs (CFSEdimCD4+Thy-1.1+ cells) were quantified in PLNs various days after cell injection. The graph shows mean data from 4 to 8 mice per time point collected from 4 independent experiments. Error bars represent SD.
Figure 2
Figure 2. Paradoxical protective effect of diabetogenic T cells in autoimmune diabetes.
(A) Diabetes incidence in ins-HA mice after transfer of freshly purified HA-Teffs (white circles, n = 13) or preactivated HA-Teffs (black circles, n = 9) or expanded HA-Tregs (white squares) or coinjection of preactivated HA-Teffs and expanded HA-Tregs (white triangles, n = 9). Data were from 4 experiments. (B) Ins-HA mice were transferred with expanded HA-Tregs alone (white squares, n = 12) or with preactivated HA-Teffs (white triangles, n = 21). 3 weeks later (arrow), mice were challenged for diabetes induction with preactivated HA-Teffs. Data were from 4 independent experiments. (C) Ins-HA mice were cotransferred with expanded HA-Tregs and the CD4+ (white triangles, n = 14) or CD4 (black diamonds, n = 12) fractions of preactivated HA-Teffs. Mice were challenged 3 weeks later (arrow) with preactivated HA-Teffs. Data were from 2 independent experiments. (D and E) Ins-HA mice were transferred with 20 × 106 expanded HA-Tregs alone (black squares, n = 4) or coinjected with 2 × 10⁶ expanded HA-Tregs and 2 × 10⁶ preactivated HA-Teffs (white triangles, n = 21) or injected with PBS only (for E). Mice were challenged 3 weeks later with preactivated HA-Teffs to test their susceptibility to diabetes induction (D) or with CFSE-labeled Thy-1.1+ preactivated HA-Teffs to analyze their activation 4 days later in PLNs (E). (E) CFSE profile and IFN-γ production of CD4+Thy-1.1+FoxP3 cells (left panels) and quantification of CD4+Thy-1.1+FoxP3IFNγ+ cell numbers (right panel). In AD, Teffs and Tregs were obtained from Thy-1.2 TCR-HA mice. Data were from 6 mice per group from 2 independent experiments. *P < 0.05; **P < 0.001. Error bars represent SD.
Figure 3
Figure 3. Strong Teff→Treg boost in NOD mice.
Four- to 7-week-old NOD mice were transferred with freshly purified CFSE-labeled CD45.2+ BDC2.5-Tregs alone or coinjected with preactivated BDC2.5-Teffs. (A) Representative CFSE profile of donor Tregs (CD4+CD45.2+ cells gated as shown in the left panel) in pancreatic islets (islets), PLNs, and nondraining LNs (NdLN) 5 days after transfer. (B) Absolute number of divided donor Tregs (CFSEdimCD4+CD45.2+FoxP3+ cells) in PLNs at day 5. Dots represent individual mice, and bars show the means pooled from 3 independent experiments. ***P < 0.0001.
Figure 4
Figure 4. Islet-specific Teffs boost polyclonal endogenous Tregs.
Four- to 7-week-old NOD mice were injected with PBS (Ctrl) or transferred with preactivated CD45.2+ BDC-Teffs. Mice were administered with the nucleotide analog EdU at days 2 to 4 and sacrificed at day 4 to analyze proliferation of endogenous Tregs. Representative profile (A) and mean from 1 representative out of 4 independent experiments (B) of DNA incorporation of EdU among endogenous Tregs (CD4+FoxP3+CD45.2) in pancreatic islets, PLN, and NdLNs. (C) Fold increase of the percentage of endogenous FoxP3+ cells among CD4+ cells between BDC-Teff–injected mice and PBS-injected mice. Mean data were obtained from 1 representative out of 4 independent experiments. *P < 0.05. Error bars represent SD.
Figure 5
Figure 5. The Teff→Treg boost is not mediated by IL-2.
(A) Ins-HA mice were transferred with CFSE-labeled Thy-1.1+ expanded HA-Tregs alone or coinjected with preactivated HA-Teffs from IL-2–deficient or IL-2–sufficient littermate control mice. Divided HA-Treg numbers (CFSEdimCD4+Thy-1.1+ cells) were quantified in PLNs 10 days later. Dots represent individual mice, and bars show the means from at least 2 independent experiments. ***P < 0.0001. (B) Ins-HA mice were transferred with CFSE-labeled Thy-1.1+ expanded HA-Tregs alone or coinjected with IL-2–sufficient HA-Teffs. Phosphorylation of STAT5 on donor Tregs (CD4+Thy-1.1+FoxP3+) was determined at the indicated times in the PLN. Top panels show representative data from 2 independent experiments. Horizontal and vertical lines delineate positive p-STAT5 staining and undivided cells, respectively. At 96 hours, some mice were injected with 250,000 IU of human IL-2 3 hours before sacrifice as a positive control for phosphorylated STAT5 staining (right panel). The bottom graph represents the mean of 1 to 3 mice per time point from 2 independent experiments. (C and D) Ins-HA mice were transferred with CFSE-labeled Thy-1.1+ expanded HA-Tregs alone or coinjected with preactivated HA-Teffs. Various doses of anti–IL-2 mAb (S4B6 mAb, expressed in μl of ascites) were administered to block IL-2 after cell transfer. 10 days later, percentage of divided cells among donor Tregs (C) as well as percentages of whole donor Tregs (black circles) and endogenous Tregs (white squares) (D) were quantified in PLNs. Representative data of 2 independent experiments with 2 or 3 mice per group. Error bars represent SD.
Figure 6
Figure 6. Tregs boosted in vitro by Teffs change their phenotype.
(A) Expanded CFSE-labeled Thy-1.1+ HA-Tregs were cultured for 5 supplemental days with IL-2–sufficient or –deficient HA-pulsed DCs alone or with freshly-purified IL-2–sufficient or –deficient HA-Teffs, in the presence or not of IL-2. Representative CFSE profile of CD4+Thy-1.1+ Tregs out of 3 independent experiments. (B and C) Comparison of the transcriptome of expanded HA-Tregs after 5 days of culture with IL-2, HA-pulsed DCs in the presence (boosted Tregs) or absence (nonboosted Tregs) of IL-2–sufficient Teffs. (B) Scatter plot comparison of average expression values in boosted Treg versus nonboosted Treg for all the 45,282 probes. Threshold lines were drawn at 1.5–fold-change expression (P ≤ 0.05), and significant probes were depicted as bold spots. Genes of interest are indicated by their symbol names. (C) Heat map of distinct expression profiles revealed by microarray analysis of the nonboosted (biological samples 1 and 2) and boosted Treg populations (samples 3 and 4). Apostrophes indicate technical replicates of each biological sample. The genes were selected based on a fold-change ≥ 2 (P ≤ 0.05). A color code scale indicates fold-change variation. (D) Tregs were cultured for 5 days as in B. Expression of the indicated molecules was compared when Tregs were cultivated with or without HA-Teffs. Histograms are representative of 2 independent experiments.
Figure 7
Figure 7. The Teff→Treg boost is TNF dependent.
(AC) Four- to 6-week-old NOD mice were transferred with freshly isolated CFSE-labeled CD45.2+ BDC2.5-Tregs alone or coinjected with preactivated CD45.1+ BDC2.5-Teffs with or without TNFR2-Fc treatment. Representative CFSE profile (A) and absolute number of divided donor Tregs (CFSEdimCD4+CD45.2+FoxP3+ cells) in PLNs 5 days after transfer (B) from 6 independent experiments. Each symbol represents an individual mouse and bars show the means. (C) Relative accumulation of divided donor Tregs in the pancreas of TNFR2-Fc–treated mice compared with PBS-treated mice 5 days after transfer. Data are from 5 independent experiments with 6 mice per group. (D and E) Representative CFSE profile (D) and absolute number (E) of donor Teffs (CD4+CD45.2+FoxP3 cells) in PLNs 5 days after cotransfer of CD45.2+ Teffs and CD45.1+ Tregs in mice treated with saline or TNFR-Fc. (F) Ins-HA mice were injected with CFSE-labeled Thy-1.1+ expanded HA-Tregs alone or with preactivated HA-Teffs with or without TNFR-Fc treatment. Absolute numbers of divided donor Tregs (CFSEdimCD4+Thy-1.1+ cells) were quantified in PLNs at day 7 after cell transfer. Each symbol represents an individual mouse, and bars show the means pooled from 3 independent experiments. *P < 0.05; **P < 0.001. Error bars represent SD.

Comment in

  • Can TNF-α boost regulatory T cells?
    Bilate AM, Lafaille JJ. Bilate AM, et al. J Clin Invest. 2010 Dec;120(12):4190-2. doi: 10.1172/JCI45262. Epub 2010 Nov 22. J Clin Invest. 2010. PMID: 21099102 Free PMC article.

References

    1. Danke NA, Koelle DM, Yee C, Beheray S, Kwok WW. Autoreactive T cells in healthy individuals. . J Immunol. 2004;172(10):5967–5972. - PubMed
    1. Horwitz MS, Bradley LM, Harbertson J, Krahl T, Lee J, Sarvetnick N. Diabetes induced by Coxsackie virus: initiation by bystander damage and not molecular mimicry. Nat Med. 1998;4(7):781–785. - PubMed
    1. Christen U, von Herrath MG. Initiation of autoimmunity. Curr Opin Immunol. 2004;16(6):759–767. doi: 10.1016/j.coi.2004.09.002. - DOI - PubMed
    1. Gabrysova L, et al. Negative feedback control of the autoimmune response through antigen-induced differentiation of IL-10-secreting Th1 cells. J Exp Med. 2009;206(8):1755–1767. doi: 10.1084/jem.20082118. - DOI - PMC - PubMed
    1. Cuffy MC, et al. Induction of indoleamine 2,3-dioxygenase in vascular smooth muscle cells by interferon-gamma contributes to medial immunoprivilege. J Immunol. 2007;179(8):5246–5254. - PubMed

Publication types

MeSH terms