. 2010 Dec;120(12):4436-44.
doi: 10.1172/JCI43786. Epub 2010 Nov 22.

Expression of αvβ8 integrin on dendritic cells regulates Th17 cell development and experimental autoimmune encephalomyelitis in mice

Affiliations

Expression of αvβ8 integrin on dendritic cells regulates Th17 cell development and experimental autoimmune encephalomyelitis in mice

Andrew C Melton et al. J Clin Invest. 2010 Dec.

Abstract

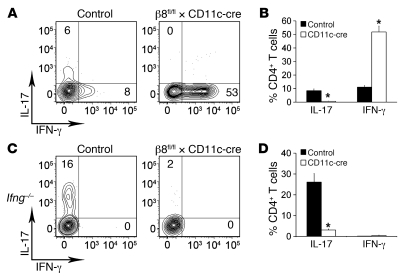
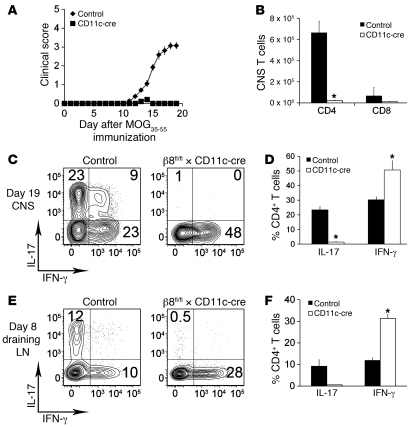
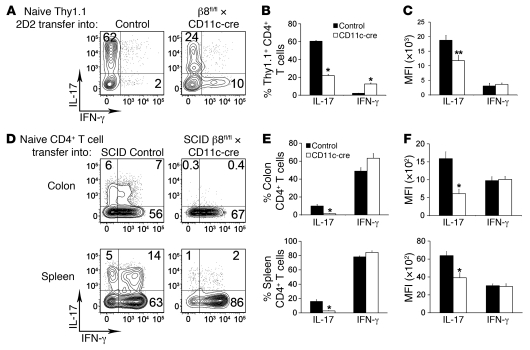
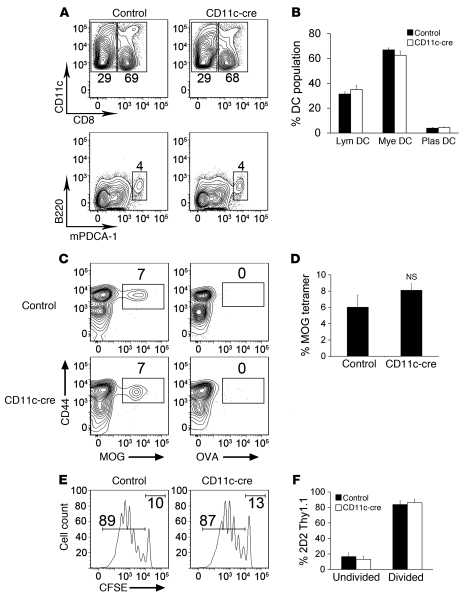
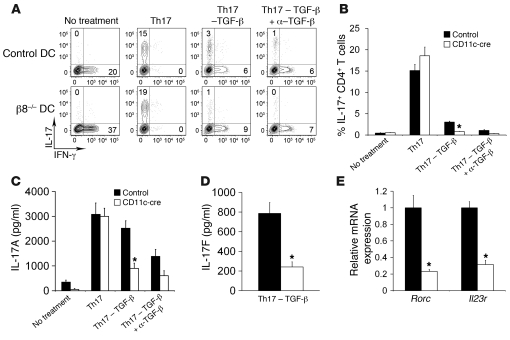
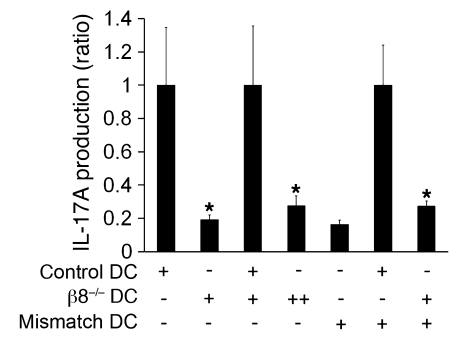
Th17 cells promote a variety of autoimmune diseases, including psoriasis, multiple sclerosis, rheumatoid arthritis, and inflammatory bowel disease. TGF-β is required for conversion of naive T cells to Th17 cells, but the mechanisms regulating this process are unknown. Integrin αvβ8 on DCs can activate TGF-β, and this process contributes to the development of induced Tregs. Here, we have now shown that integrin αvβ8 expression on DCs plays a critical role in the differentiation of Th17 cells. Th17 cells were nearly absent in the colons of mice lacking αvβ8 expression on DCs. In addition, these mice and the DCs harvested from them had an impaired ability to convert naive T cells into Th17 cells in vivo and in vitro, respectively. Importantly, mice lacking αvβ8 on DCs showed near-complete protection from experimental autoimmune encephalomyelitis. Our results therefore suggest that the integrin αvβ8 pathway is biologically important and that αvβ8 expression on DCs could be a therapeutic target for the treatment of Th17-driven autoimmune disease.


Figures

Figure 1
Figure 1. Impaired Th17 development in β8fl/fl × CD11c-cre mice.
(A and C) Flow cytometry plots of control and β8fl/fl × CD11c-cre (A) or Ifng–/– control and Ifng–/– β8fl/fl × CD11c-cre (C) colon lamina propria CD4+ T cells stained for IL-17 and IFN-γ after activation with PMA/ionomycin. Numbers in quadrants indicate the percentage of positive cells. (B and D) Percentage of IL-17– and IFN-γ–producing CD4+ T cells isolated from the colon lamina propria of control and β8fl/fl × CD11c-cre (B) or Ifng–/– control and Ifng–/– β8fl/fl × CD11c-cre (D) mice after activation with PMA/ionomycin. Data represent the mean ± SEM of 3 independent experiments and more than 6 mice per group. *P < 0.005.
Figure 2
Figure 2. β8fl/fl × CD11c-cre mice are protected from EAE.
(A) Clinical scores of control and β8fl/fl × CD11c-cre mice after EAE immunization. (B) Total number of CD4 and CD8 T cells isolated from the CNS of control or β8fl/fl × CD11c-cre mice on day 19 after EAE immunization. (C) Flow cytometry plots of CD4+ T cells from the CNS of control or β8fl/fl × CD11c-cre mice on day 19 after EAE immunization. Cells were activated with PMA/ionomycin and then stained for IL-17 and IFN-γ. (D) Percentage of IL-17– and IFN-γ–producing CD4+ T cells from the CNS of control and β8fl/fl × CD11c-cre mice. (E) Flow cytometry plots of CD4+ T cells from the draining lymph nodes of control or β8fl/fl × CD11c-cre mice on day 8 after EAE immunization. Cells were activated with PMA/ionomycin and then stained for IL-17 and IFN-γ. (F) Percentage of IL-17– and IFN-γ–producing CD4+ T cells from the draining lymph nodes of control and β8fl/fl × CD11c-cre mice. Data represent the means ± SEM of 3 independent experiments and at least 10 mice in each group. *P < 0.01.
Figure 3
Figure 3. Blunted Th17 conversion of naive CD4+ T cells adoptively transferred into β8fl/fl × CD11c-cre mice.
(A) Flow cytometry plots of Thy1.1 2D2 TCR transgenic T cells isolated from the spleen and draining lymph nodes 8 days after transfer into control or β8fl/fl × CD11c-cre mice immunized with MOG plus CFA. Isolated cells were activated with PMA/ionomycin and stained for IL-17 and IFN-γ. Numbers in quadrants indicate the percentage of positive cells. (B) Percentage of IL-17– and IFN-γ–producing Thy1.1+ CD4+ T cells isolated from control and β8fl/fl × CD11c-cre mice. (C) MFI of IL-17 and IFN-γ staining in Thy1.1+CD4+ T cells isolated from control and β8fl/fl × CD11c-cre mice. (D) Flow cytometry plots of polyclonal CD4+ T cells isolated from the colonic lamina propria (top) or spleen (bottom) 12 days after transfer into SCID control or SCID β8fl/fl × CD11c-cre mice. Isolated cells were activated with PMA/ionomycin and stained for IL-17 and IFN-γ. Numbers in quadrants indicate the percentage of positive cells. (E) Percentage of IL-17– and IFN-γ–producing CD4+ T cells isolated from control and β8fl/fl × CD11c-cre mice. (F) MFI of IL-17 and IFN-γ staining in CD4+ T cells isolated from control and β8fl/fl × CD11c-cre mice. Data represent the mean ± SEM of 2 independent experiments and 3 to 5 mice per group. *P < 0.005; **P < 0.01.
Figure 4
Figure 4. Characterization of draining lymph node DCs in β8fl/fl × CD11c-cre mice.
(A) Flow cytometry plots of MHCII+CD11c+ DCs isolated from the draining lymph nodes of control or β8fl/fl × CD11c-cre mice 7 days after in vivo stimulation with CFA. DCs within plots are gated on CD8+ (lymphoid) and CD8 (myeloid) DCs (top) or B220+mPDCA-1+ (plasmacytoid; bottom). Numbers next to the gates indicate the percentage of CD8+ or CD8 MHCII+CD11c+ cells (top) or B220+mPDCA-1+MHCII+CD11c+ cells (bottom). (B) Percentage of lymphoid (Lym), myeloid (Mye), and plasmacytoid (Plas) DCs isolated from control β8fl/fl × CD11c-cre mice. (C) Flow cytometry plots of CD4+ T cells isolated from control or β8fl/fl × CD11c-cre mice 7 days after immunization with MOG plus CFA and stained with MHCII tetramers loaded with MOG or OVA peptide. Numbers above the gates indicate the percentage of cells labeled with tetramer after enrichment for tetramer-positive cells. (D) Percentage of CD4+ T cells labeled with MOG tetramer after enrichment for tetramer-positive cells isolated from control or β8fl/fl × CD11c-cre mice. (E) Flow cytometry histograms of CFSE-stained Thy1.1+2D2+ TCR transgenic T cells isolated from control or β8fl/fl × CD11c-cre mice 7 days after immunization with MOG plus CFA. Numbers above gates indicate the percentage of divided (left gate) and undivided (right gate) cells. (F) Percentage of undivided and divided 2D2+ Thy1.1+ cells isolated from control or β8fl/fl × CD11c-cre mice.
Figure 5
Figure 5. DCs from β8fl/fl × CD11c-cre mice fail to drive Th17 development through a defect in TGF-β activation.
(A) Flow cytometry plots of naive CD4+ 2D2 TCR transgenic T cells after culture with DCs from control or β8fl/fl × CD11c-cre mice for 5 days. Cells were activated with PMA/ionomycin for 4 hours and then stained for IL-17 and IFN-γ. Cultures were grown under the following conditions: no treatment, Th17 (see Methods), Th17 without TGF-β, and Th17 with TGF-β–neutralizing antibody. (B) Percentage of IL-17–producing CD4+ 2D2 T cells after cultured as described in A. (C) Measurement of IL-17A in the supernatants of the cultures described in A using ELISA. (D) Measurement of IL-17F in the supernatant of the Th17 without the TGF-β condition described in A. (E) qRT-PCR analysis of the Rorc and Il23r genes from T cells after culture under the Th17 without the TGF-β condition described in A. Data represent the means ± SEM of at least 3 independent experiments with 8 mice in each group. *P < 0.01.
Figure 6
Figure 6. Th17 development through integrin αvβ8 on DCs is dependent on MHCII-TCR engagement.
DCs were isolated from control, β8fl/fl × CD11c-cre, and MHCII-mismatched (H2q MHC haplotype from FVB strain) mice and cultured in different combinations with naive CD4+ 2D2 TCR transgenic T cells under Th17-driving conditions without exogenous TGF-β. Supernatants were collected and analyzed by ELISA for the presence of IL-17. Data are means ± SEM of the ratio of IL-17 produced between control and β8fl/fl × CD11c-cre wells under each condition. Twice as many β8fl/fl × CD11c-cre DCs were present in 1 condition (indicated by ++) to account for a doubling in the number of DCs in the control plus β8–/– group. MHCII-mismatched DCs were present in cultures at a 4:1 ratio, compared with control or β8–/– DCs. *P < 0.05.

Comment in

Similar articles

Cited by

References

    1. Korn T, Bettelli E, Oukka M, Kuchroo VK. IL-17 and Th17 cells. Annu Rev Immunol. 2009;27:485–517. doi: 10.1146/annurev.immunol.021908.132710. - DOI - PubMed
    1. Bettelli E, et al. Reciprocal developmental pathways for the generation of pathogenic effector TH17 and regulatory T cells. Nature. 2006;441(7090):235–238. doi: 10.1038/nature04753. - DOI - PubMed
    1. Veldhoen M, Hocking RJ, Atkins CJ, Locksley RM, Stockinger B. TGFbeta in the context of an inflammatory cytokine milieu supports de novo differentiation of IL-17-producing T cells. Immunity. 2006;24(2):179–189. - PubMed
    1. Mangan PR, et al. Transforming growth factor-beta induces development of the T(H)17 lineage. Nature. 2006;441(7090):231–234. doi: 10.1038/nature04754. - DOI - PubMed
    1. Korn T, et al. IL-21 initiates an alternative pathway to induce proinflammatory T(H)17 cells. Nature. 2007;448(7152):484–487. - PMC - PubMed

Publication types

MeSH terms