. 2011;3(2):150-66.
doi: 10.1159/000321725. Epub 2010 Nov 23.

Activation of pulmonary dendritic cells and Th2-type inflammatory responses on instillation of engineered, environmental diesel emission source or ambient air pollutant particles in vivo

Affiliations

Activation of pulmonary dendritic cells and Th2-type inflammatory responses on instillation of engineered, environmental diesel emission source or ambient air pollutant particles in vivo

Gillina F G Bezemer et al. J Innate Immun. 2011.

Abstract

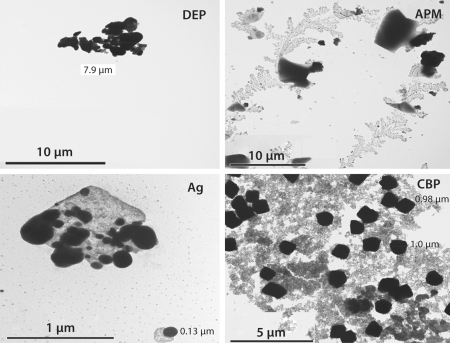
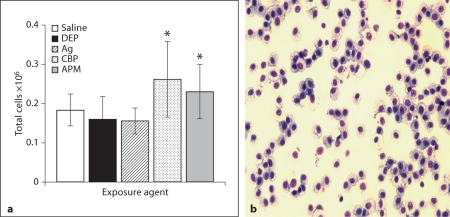
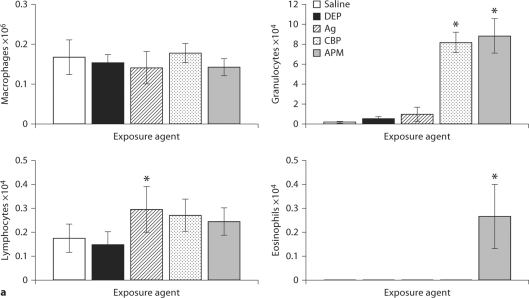
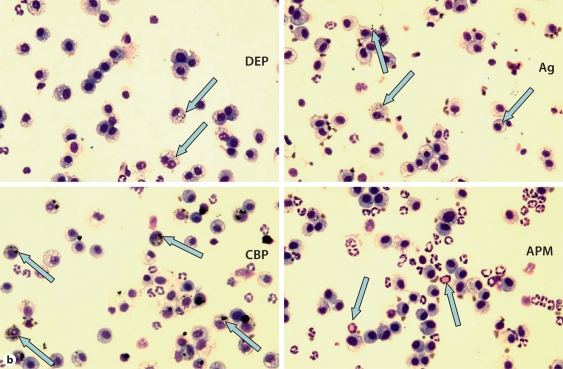
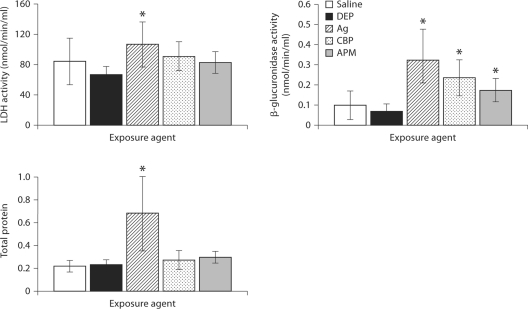
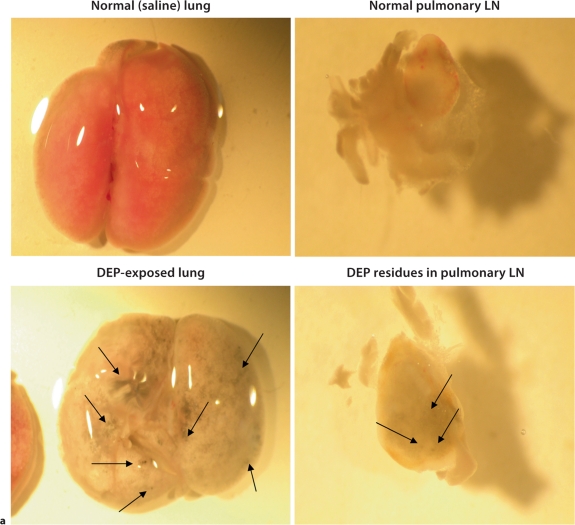
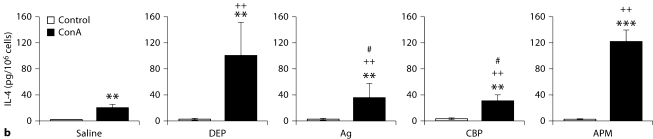
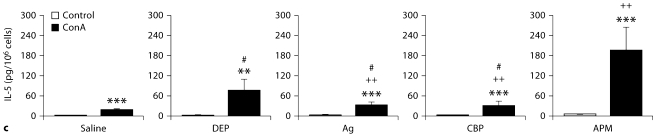
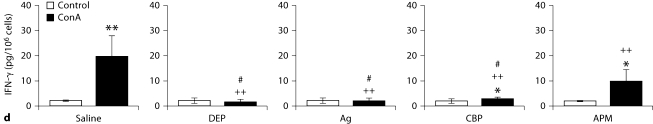
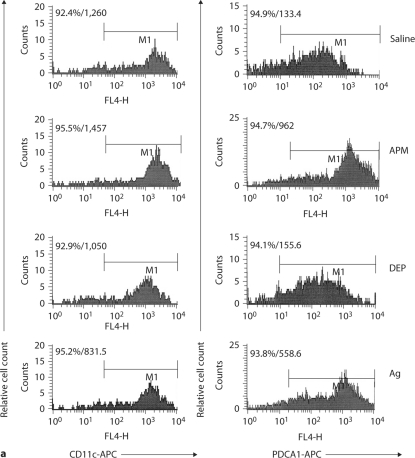
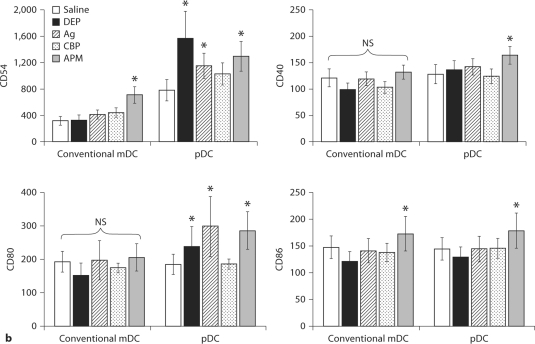
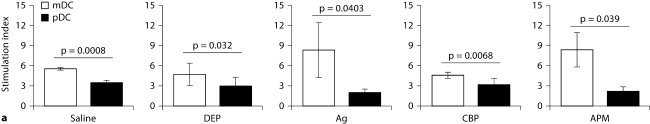
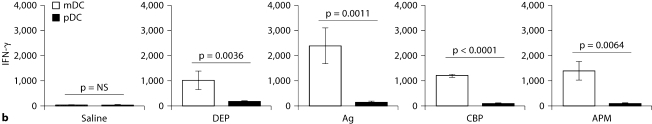
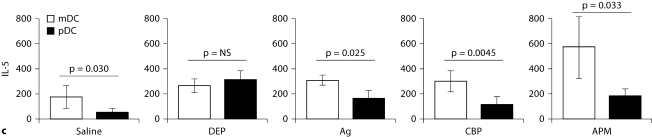
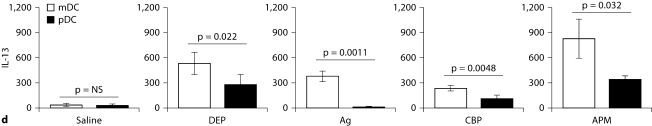
The biological effects of acute particulate air pollution exposure in host innate immunity remain obscure and have relied largely on in vitro models. We hypothesized that single acute exposure to ambient or engineered particulate matter (PM) in the absence of other secondary stimuli would activate lung dendritic cells (DC) in vivo and provide information on the early immunological events of PM exposure and DC activation in a mouse model naïve to prior PM exposure. Activation of purified lung DC was studied following oropharyngeal instillation of ambient particulate matter (APM). We compared the effects of APM exposure with that of diesel-enriched PM (DEP), carbon black particles (CBP) and silver nanoparticles (AgP). We found that PM species induced variable cellular infiltration in the lungs and only APM exposure induced eosinophilic infiltration. Both APM and DEP activated pulmonary DC and promoted a Th2-type cytokine response from naïve CD4+ T cells ex vivo. Cultures of primary peribronchial lymph node cells from mice exposed to APM and DEP also displayed a Th2-type immune response ex vivo. We conclude that exposure of the lower airway to various PM species induces differential immunological responses and immunomodulation of DC subsets. Environmental APM and DEP activated DC in vivo and provoked a Th2 response ex vivo. By contrast, CBP and AgP induced altered lung tissue barrier integrity but failed to stimulate CD4+ T cells as effectively. Our work suggests that respirable pollutants activate the innate immune response with enhanced DC activation, pulmonary inflammation and Th2-immune responsiveness.


Figures

Fig. 1
Fig. 1
Difference in agglomeration state of PM species by SEM. Microscopic appearance of the AgP, DEP, APM and CBP particles used in these studies. Original magnification, ×400.
Fig. 2
Fig. 2
Total cell quantitation in BALF harvestedfrom PM-exposed mice. Shownhere are the mean total cell counts ×106 infiltrating the lung as determined by cytologicalexamination of cytospinned cellpreparations (a). Data are shown as thearithmetic mean of 16–19 measurements ± SD. Also shown is a cytological BALFpreparation of a saline-only-exposedmouse (b). The majority of the cells werefound to be macrophages (b).
Fig. 3
Fig. 3
Detailed quantitation of differential cell frequencies found in the BALF of PM-exposed mice. Inflammatory cell infiltration was determined on cytocentrifuged cell preparations (see ‘Materials and Methods’) in BALF 24 h following PM exposure (a). Shown here are the arithmetic mean counts ± SD of n = 16–19 total mice per exposure, for lymphocytes, macrophages, granulocytic neutrophils and eosinophils. Eosinophilic infiltration was only seen in APM-exposed mice. Granulocytic neutrophil infiltration was seen in both CBP- and APM-exposed mice. Significantly different from saline control: ∗ p < 0.05. Representative light microscopic images of a typical field of view of cytocentrifuged BALF preparations for each of the four exposures are also shown (b). The phagocytic ability of macrophages can be appreciated for CBP-, DEP- and AgP-exposed mice (arrows). Eosinophilic infiltration was only seen in APM-exposed mice (arrows pointing at identified eosinophils). Representative microscope images were taken from Diff Quick-stained cytospinned BALF cells from particulate exposed mice. Original magnification, ×100.
Fig. 3
Fig. 3
Detailed quantitation of differential cell frequencies found in the BALF of PM-exposed mice. Inflammatory cell infiltration was determined on cytocentrifuged cell preparations (see ‘Materials and Methods’) in BALF 24 h following PM exposure (a). Shown here are the arithmetic mean counts ± SD of n = 16–19 total mice per exposure, for lymphocytes, macrophages, granulocytic neutrophils and eosinophils. Eosinophilic infiltration was only seen in APM-exposed mice. Granulocytic neutrophil infiltration was seen in both CBP- and APM-exposed mice. Significantly different from saline control: ∗ p < 0.05. Representative light microscopic images of a typical field of view of cytocentrifuged BALF preparations for each of the four exposures are also shown (b). The phagocytic ability of macrophages can be appreciated for CBP-, DEP- and AgP-exposed mice (arrows). Eosinophilic infiltration was only seen in APM-exposed mice (arrows pointing at identified eosinophils). Representative microscope images were taken from Diff Quick-stained cytospinned BALF cells from particulate exposed mice. Original magnification, ×100.
Fig. 4
Fig. 4
Quantitation of biochemical parameters of BALF indicative of cellular cytotoxicity and activation. Increased cell permeability (tissue or cell damage), as measured by LDH release and total protein, was only seen in AgP-exposed mice. In addition, macrophage activation was measured by β-glucuronidase activity assay. By this assay, AgP, CBP and APM all differentially activated macrophages. Data are shown as the arithmetic mean of 16–19 measurements ± SD. Measured values significantly different from saline control: ∗ p < 0.05.
Fig. 5
Fig. 5
Differential Th2-type immune responses of lymph node T cells following in vivo exposure to PM species. We first confirmed that oropharyngeal delivery of PM was present in the lung and in the draining peribronchial lymph nodes (a). Shown are DEP-exposed mouse lung and lymph nodes as compared with mice exposed to saline alone. Original magnification, < 10. Arrows point at PM residues in the lungs and peribronchial lymph nodes indicating that PM translocates from the lung to the lymph nodes in migratory cells and/or the afferent lymphatics (a). Secretion of the Th2-type cytokines IL-4 (b) and IL-5 (c) and the Th1-type cytokine IFN-γ (d) is also shown for pLNC suspensions of PM-exposed mice (see ‘Materials and Methods’). Data are recorded as picograms of cytokine per 106 cells (mean ± SEM, n = 4; ∗∗ p < 0.01 as compared with resting cells; ++ p < 0.01 as compared with saline-exposed mice; # p < 0.05 as compared with DEP- or APM-exposed mice).
Fig. 5
Fig. 5
Differential Th2-type immune responses of lymph node T cells following in vivo exposure to PM species. We first confirmed that oropharyngeal delivery of PM was present in the lung and in the draining peribronchial lymph nodes (a). Shown are DEP-exposed mouse lung and lymph nodes as compared with mice exposed to saline alone. Original magnification, < 10. Arrows point at PM residues in the lungs and peribronchial lymph nodes indicating that PM translocates from the lung to the lymph nodes in migratory cells and/or the afferent lymphatics (a). Secretion of the Th2-type cytokines IL-4 (b) and IL-5 (c) and the Th1-type cytokine IFN-γ (d) is also shown for pLNC suspensions of PM-exposed mice (see ‘Materials and Methods’). Data are recorded as picograms of cytokine per 106 cells (mean ± SEM, n = 4; ∗∗ p < 0.01 as compared with resting cells; ++ p < 0.01 as compared with saline-exposed mice; # p < 0.05 as compared with DEP- or APM-exposed mice).
Fig. 6
Fig. 6
Expression of function-associated cell surface molecules by pulmonary DC subsets. Highly purified PDCA-1+ pDC and CD11c+ conventional mDC were obtained from the pooled lungs of 4 mice for each individual experiment. Typical flow histograms (a) of purified pDC and mDC show percent positively stained cells and MFI units for saline-, APM-, DEP- and AgP-exposed mice. Similar data were also found for CBP (not shown).
Fig. 6
Fig. 6
Expression of function-associated cell surface molecules by pulmonary DC subsets. Highly purified PDCA-1+ pDC and CD11c+ conventional mDC were obtained from the pooled lungs of 4 mice for each individual experiment. Typical flow histograms (a) of purified pDC and mDC show percent positively stained cells and MFI units for saline-, APM-, DEP- and AgP-exposed mice. Similar data were also found for CBP (not shown).
Fig. 7
Fig. 7
Stimulation of naïve CD4+ T cell proliferation and Th1/Th2 cytokine elaboration by in vivo PM-exposed lung DCs. Purified DC of PM-exposed mice were pulsed with OVA (50 μg/ml, 4 h) as a model antigen, washed and cocultured with highly purified naïve CD4+ CD62L+ T cells of transgenic OT-II.2 mice expressing the T cell receptor specific for OVA323–339 and MHC class II-Ab (for a ratio of DC to T cells of 1: 5), as described above. T cell proliferation was measured based on a standard BrdU uptake assay (a). Data are presented as the mean stimulation index of at least 4 individual experiments ± SD, where: stimulation index = [(OD coculture) – (OD T cells cultured alone)]/(OD T cells cultured alone). In each individual experiment DCs were isolated from the pooled lungs of 4 animals. The indicated p values show that mDC were more effective than their pDC counterparts with the greatest levels of proliferation seen in Ag- and APM-exposed mice (a). Coculture supernatants were assayed by multiplex cytokine arrays for secretion of the Th1-associated cytokine IFN-γ (b) and the Th2-associated cytokines IL-5 (c) and IL-13 (d). Data were recorded as picograms of cytokine per 106 cells.
Fig. 7
Fig. 7
Stimulation of naïve CD4+ T cell proliferation and Th1/Th2 cytokine elaboration by in vivo PM-exposed lung DCs. Purified DC of PM-exposed mice were pulsed with OVA (50 μg/ml, 4 h) as a model antigen, washed and cocultured with highly purified naïve CD4+ CD62L+ T cells of transgenic OT-II.2 mice expressing the T cell receptor specific for OVA323–339 and MHC class II-Ab (for a ratio of DC to T cells of 1: 5), as described above. T cell proliferation was measured based on a standard BrdU uptake assay (a). Data are presented as the mean stimulation index of at least 4 individual experiments ± SD, where: stimulation index = [(OD coculture) – (OD T cells cultured alone)]/(OD T cells cultured alone). In each individual experiment DCs were isolated from the pooled lungs of 4 animals. The indicated p values show that mDC were more effective than their pDC counterparts with the greatest levels of proliferation seen in Ag- and APM-exposed mice (a). Coculture supernatants were assayed by multiplex cytokine arrays for secretion of the Th1-associated cytokine IFN-γ (b) and the Th2-associated cytokines IL-5 (c) and IL-13 (d). Data were recorded as picograms of cytokine per 106 cells.

Similar articles

Cited by

References

    1. Cohn L, Elias JA, Chupp GL. Asthma: mechanisms of disease persistence and progression. Annu Rev Immunol. 2004;22:789–815. - PubMed
    1. Galli SJ, Tsai M, Piliponsky AM. The development of allergic inflammation. Nature. 2008;454:445–454. - PMC - PubMed
    1. Nel AE, Diaz-Sanchez D, Ng D, Hiura T, Saxon A. Enhancement of allergic inflammation by the interaction between diesel exhaust particles and the immune system. J Allergy Clin Immunol. 2008;102:539–554. - PubMed
    1. Wills-Karp M. Immunologic basis of antigen-induced airway hyperresponsiveness. Annu Rev Immunol. 1999;17:255–281. - PubMed
    1. Porter M, Karp M, Killedar S, Bauer SM, Guo J, Williams D, Breysse P, Georas SN, Williams MA. Diesel-enriched particulate matter functionally activates human dendritic cells. Am J Respir Cell Mol Biol. 2007;37:706–719. - PMC - PubMed

Publication types