Comparative Study
. 1990 Apr;258(4 Pt 2):H1012-24.
doi: 10.1152/ajpheart.1990.258.4.H1012.

Heterogeneities in regional volumes of distribution and flows in rabbit heart

Affiliations
Comparative Study

Heterogeneities in regional volumes of distribution and flows in rabbit heart

F Gonzalez et al. Am J Physiol. 1990 Apr.

Abstract

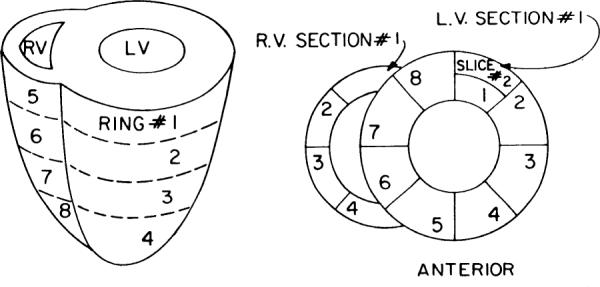
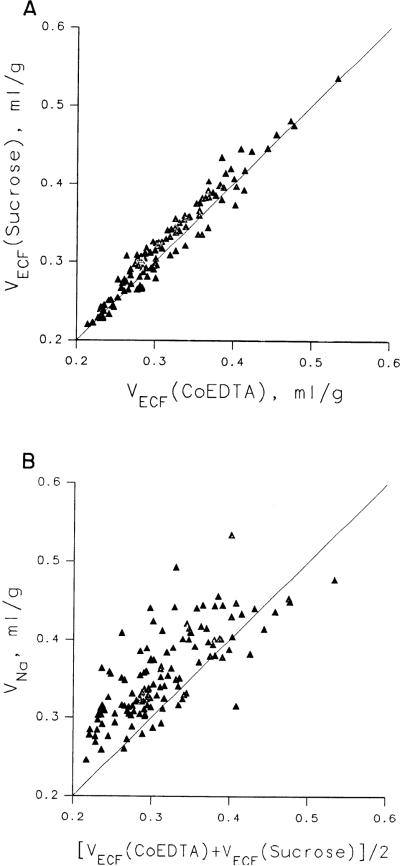
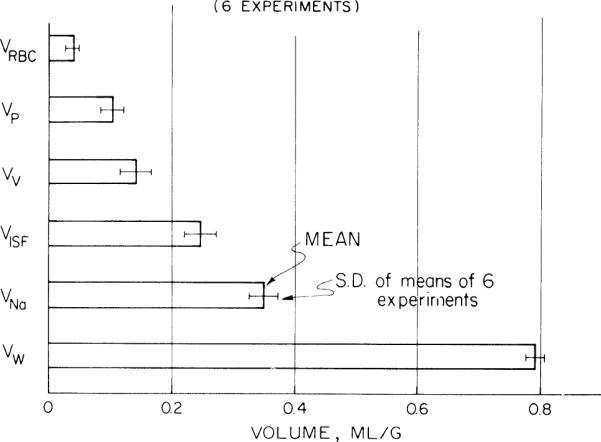
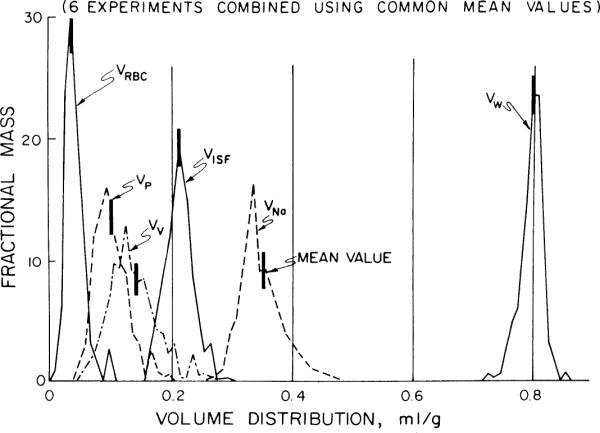
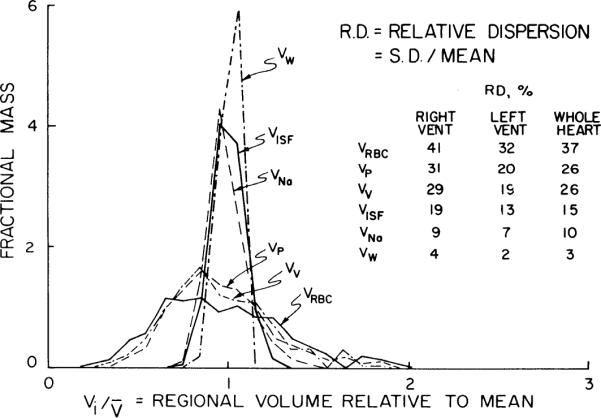
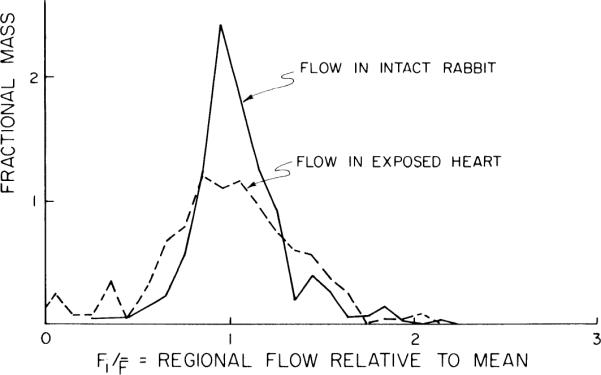
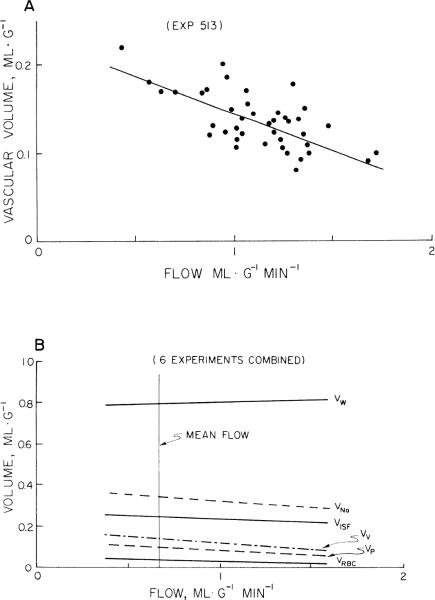
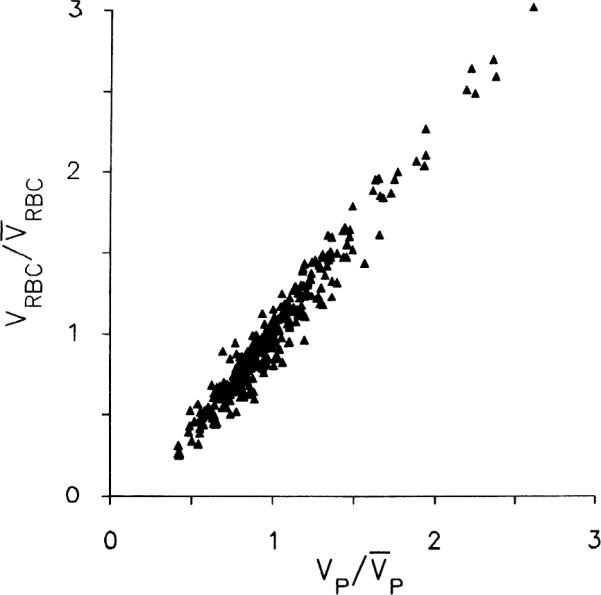
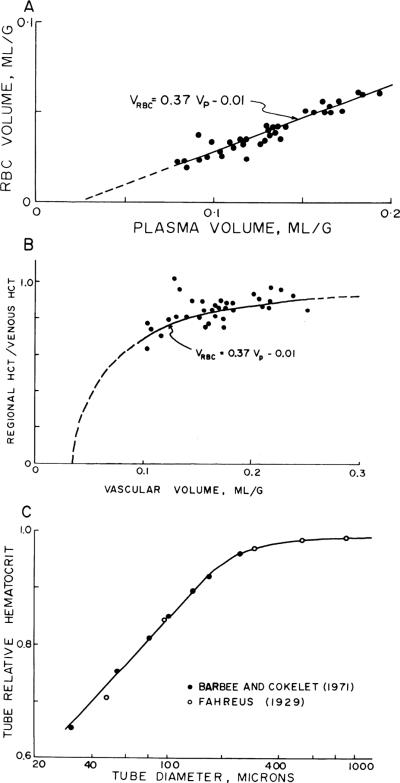
The heterogeneity of volumes of distribution in the heart influences the rates of uptake and washout of substrates and metabolites; thus it is important to evaluate their variability in the normal heart. Several tracers were injected intravenously into anesthetized adult closed-chest rabbits, and time was allowed for equilibration in the heart. Tracer microspheres were injected into the left ventricular cavity at the apex for the measurement of regional flows, the chest was opened, another set of microspheres was injected, and the heart was frozen rapidly in situ with liquid nitrogen-cooled Freon-22. Each heart was divided into 72 pieces of less than 0.1 g weight, and the tracer content of each was determined by multichannel gamma-counting and the water content by desiccation. The regional myocardial flows were (closed chest) 0.62 +/- 0.16 ml.g-1.min-1 and (open chest) 0.63 +/- 0.37 ml.g-1.min-1. The volumes of distribution (ml/g) for the 432 pieces for six rabbits, given as mean +/- SD (% coefficient of variation), were as follows: for plasma, VP = 0.11 +/- 0.03 (26%); erythrocytes, VRBC = 0.041 +/- 0.015 (37%); vascular space, VV = 0.15 +/- 0.04 (26%); extracellular space, VECF = 0.33 +/- 0.05 (15%); interstitial space, VISF = 0.21 +/- 0.03 (15%); and water space, VW -0.79 +/- 0.022 (2.8%). Regional hematocrits were 77% +/- 9% of the large-vessel hematocrits.


Figures

Fig. 1
Fig. 1
Format for partitioning ventricles of rabbit heart. Four transverse rings are shown on left. Four rings of left ventricle (LV) are divided into 8 sections, each of which in turn is divided into endocardial and epicardial slices, except for apical ring where wall was too thin to merit separating endo- from epicardium. Total equalled 72 pieces, averaging ~0.1 g. RV, right ventricle.
Fig. 2
Fig. 2
Estimates of volumes of distribution of extracellular markers. A: comparison of extracellular fluid space volume (VECF) estimates from [14C]sucrose vs. 58Co-EDTA (from γ-counting rather than β-counting). Regression line, VECF(Suc) = 0.001 + 1.03 VECF(58Co-EDTA), with a correlation coefficient of 0.974, is not distinguishable from line of identity. Average VECF for 2 tracers is 0.32 ± 0.06 (N = 130) ml of plasma-equivalent volume/gram of myocardium. [Data from same experiment as in Fig. 2 of Bridge et al. (11).] B: comparison of sodium space volume (VNa) with VECF, where VECF is average in each piece for VECF([14C]Suc) and VECF(58Co-EDTA) (γ-counts). Ratio VNa/VECF averaged 1.13 ± 0.08 in this comparison.
Fig. 3
Fig. 3
Volumes of distributions in whole left ventricle of rabbit heart calculated from tracers labeling erythrocyte space (VRBC), plasma space (VP), vascular space (VV), interstitial fluid space (VISF), sodium space (VNa), and water space (VW). Error bars give standard deviations of means of each of 6 rabbit left ventricles.
Fig. 4
Fig. 4
Probability density functions of volumes of distributions in rabbit left ventricle. Mean values and abbreviations are those shown in Fig. 3. Density functions for 6 animals are combined by superimposing mean of each individual heart upon average mean; this provides a correct and realistic representation of spread of the data around mean.
Fig. 5
Fig. 5
Normalized probability density functions for volumes of distributions in left ventricle of 6 rabbits. Distributions are composed of individual pieces from 6 ventricles, a total of 56 × 6 or 336 pieces, and volume of distribution in each piece is plotted relative to the mean for whole 336 pieces. Relative dispersions are therefore larger than for individual animals, of which Fig. 4 gives a closer representation. For abbreviations see Fig. 2 legend. (See Table 2 for the contrasting viewpoints.)
Fig. 6
Fig. 6
Probability density functions of regional flows in ~0.1-g pieces of left ventricular myocardium of an anesthetized rabbit. Microspheres labeled with 46Sc were injected into apical region of left ventricular cavity 5 min before thoracotomy [solid line, intact rabbit, relative dispersion (RD) = 0.25] and 95Nb-labeled microspheres a few seconds after (dashed line, exposed heart, RD = 0.37).
Fig. 7
Fig. 7
Regional volumes of distribution and regional flows. Abscissa is regional capillary blood flow (FB). A: vascular volume (VV) vs. flow in experiment with steepest relationship. Regression line is VV = 0.22 – 0.08 FB. B: volumes of distribution vs. regional flow for all pieces of left ventricles of 6 rabbits. Higher flow regions have smaller vascular volumes, but interstitial fluid space volume appeared unaffected and water snace volume may be slightly higher.
Fig. 8
Fig. 8
Relationship between erythrocyte volume of distribution (VRBC) and regional plasma volume (VP) in left ventricular myocardium of 6 rabbits. Ordinate is VRBC for each piece of tissue divided by average of VRBCS for whole left ventricle of same rabbit. Abscissa is constructed the same way for VP. Regression line (minimizing perpendiculars) is (VRBCVRBC)=1.25(VPVP)0.25 (where overbar denotes mean value), with a correlation coefficient of 0.977. Note that both VP and VRBC exhibit strongly skewed distribution ranging from 30 to 40% of mean to >250% of mean.
Fig. 9
Fig. 9
Regional hematocrits vs. vascular volume. A: in one of the experiments allowing only 5 min for intravascular mixing, erythrocyte volume (VRBC) is plotted vs. plasma volume (VP) as in Fig. 8, for left ventricular myocardium only. B: regional hematocrit (Hct) is plotted as a fraction of large-vessel hematocrit (HctLV) vs. regional vascular volume (VV); it is lowest in regions having small vascular volumes. Curved line is same regression equation of A for this one heart, now plotted as Hct vs. VV. Lowest regional hematocrits are ~60% of HctLV. These data may be compared with those in C. C: data of Barbee and Cokelet (2) on Fahraeus-Lindqvist effect in glass tubes showing diminution of Hct in tubes of <300 μm in diameter for comparison with B.
Fig. 10
Fig. 10
Probability density functions of transit times for water (τW), interstitial fluid (τISF), and blood spaces (τB) from data on individual pieces from whole heart. Transit time, τ, is a mean for each piece, volume of distribution divided by relevant flow: τB = VV/FB, τISF = VISF/VP, and τW = VW/FW (see Eq. 16), VV, VISF, VP, and VW are distribution of volumes for vascular, interstitial fluid, plasma, and water spaces and FB and FW are regional blood and water flows.

Similar articles

Cited by

References

    1. Altman PL, Dittmer DS, editors. Respiration and Circulation. FASEB; Bethesda, MD: 1971.
    1. Barbee JH, Cokelet GR. The Fahraeus effect. Microvasc. Res. 1971;3:6–16. - PubMed
    1. Bass L, Robinson PJ. Effects of capillary heterogeneity on rates of steady uptake of substances by the intact liver. Microvasc. Res. 1981;22:43–57. - PubMed
    1. Bassingthwaighte JB. A concurrent flow model for extraction during transcapillary passage. Circ. Res. 1974;35:483–503. - PMC - PubMed
    1. Bassingthwaighte JB, Dobbs WA, Yipintsoi T. Heterogeneity of myocardial blood flow. In: Maseri A, editor. Myocardial Blood Flow in Man: Methods and Significance in Coronary Disease. Minerva Medica; Torino, Italy: 1972. pp. 197–205.

Publication types

LinkOut - more resources