. 2011 Mar;69(3):200-5.
doi: 10.1203/PDR.0b013e3182070ec8.

Modulation of sodium transport in alveolar epithelial cells by estradiol and progesterone

Affiliations

Modulation of sodium transport in alveolar epithelial cells by estradiol and progesterone

Mandy Laube et al. Pediatr Res. 2011 Mar.

Abstract

The effects of estradiol (E2) and progesterone (P) on alveolar epithelial Na+ transport were studied in isolated alveolar epithelial cells from 18- to 19-d GA rat fetuses, grown to confluence in serum-free media supplemented with E2 (0-1 μM) and P (0-2.8 μM). Short-circuit currents (ISC) were measured, showing an increase by E2 and P in a dose-dependent manner. The Na,K-ATPase subunits -α1 and -β1 were detected by Western blotting, but total expression was not significantly altered. Furthermore, all three epithelial Na+ channel (ENaC) subunits -α, -β, and -γ were detected, with trends toward a higher expression in the presence of E2 and P. Real-time PCR revealed an increase of α- and β-ENaC expression but no alteration of γ-ENaC. In addition, the mRNA expression of cystic fibrosis transmembrane conductance regulator (CFTR) and Na,K-ATPase-β1 subunit were elevated in the presence of E2 and P. Single-channel patch clamp analysis demonstrated putative highly selective and nonselective cation channels in the analyzed cells, with a higher percentage of responsive patches under the influence of E2 and P. We conclude that E2 and P increased Na+ transport in alveolar epithelial cells by enhancing the expression and activity of ENaC and Na,K-ATPase.


Figures

Figure 1
Figure 1
Effect of E2 and P exposure during cell culture on ISC in rat FDLE cells. Baseline was the ISC after mounting the monolayers in the Ussing chambers, Iamil the current reduction by amiloride (10 μM), and Iouab the ouabain- (1 mM) sensitive current. Media 1 to 6 refer to the concentrations of E2 and P in the culture medium as outlined in Table 1. Error bars represent SEM, *p < 0.05 by Dunnett's post hoc test. Medium 1 (▪), medium 2 (□), medium 3 (formula image), medium 4 (⊠), medium 5 (formula image), and medium 6 (formula image).
Figure 2
Figure 2
(A) Effect of E2 and P exposure during cell culture on ouabmax in rat FDLE cells. Baseline was the ISC after mounting the monolayers in the Ussing chambers, Iamph the current after adding 10 μM amphotericin B to the apical compartment, and ouabmax the current reduction caused by 1 mM ouabain. (B) Effect of E2 and P exposure during cell culture on amilmax in rat FDLE cells. The monolayers were subjected to a 145:5 apical to basolateral Na+ gradient, the basolateral membrane permeabilized by 100 μM amphotericin B, and 10 μM amiloride was given into the apical compartment at the maximum current increase. *p < 0.05 by Dunnett's post hoc test. Medium 1 (▪), medium 2 (□), medium 3 (formula image), medium 4 (⊠), medium 5 (formula image), and medium 6 (formula image).
Figure 3
Figure 3
(A) Single-channel recordings of rat FDLE cells subjected to different concentrations of E2 and P. HSC represents a putative highly-selective cation channel of ENaC with a unitary conductance of ∼4 pS. NSC refers to a putative nonselective cation channel of ENaC with a unitary conductance of ∼23 pS. (B) Comparison of the percentage of responsive patches showing single-channel activity in cells incubated with different concentrations of E2 and P (n = 20 for medium 1, n = 19 for medium 5, and n = 11 for medium 6). *p < 0.05 by Fisher's exact test. Medium 1 (▪), medium 5 (formula image), and medium 6 (formula image).
Figure 4
Figure 4
The RT-PCR analysis of the mRNA expression level of the α-ENaC subunit (A), the β-ENaC subunit (B), and the γ-ENaC subunit (C) in rat FDLE cells subjected to different concentrations of E2 and P. *p < 0.05 by Dunnett's post hoc test. Medium 1 (▪), medium 4 (⊠), medium 5 (formula image), and medium 6 (formula image).
Figure 5
Figure 5
The RT-PCR analysis of the mRNA expression level of the Na,K-ATPase-β1 subunit (A), CFTR (B), VEGF-A (C), and ER-β (D) in rat FDLE cells subjected to different concentrations of E2 and P. *p < 0.05 by Dunnett's post hoc test. Medium 1 (▪), medium 4 (⊠), medium 5 (formula image), and medium 6 (formula image)..
Figure 6
Figure 6
(A) Western blot of α-, β-, and γ-ENaC subunits in FDLE cells grown in the presence of different concentrations of E2 and P. The numbers on top refer to the E2 and P concentrations in the culture medium as outlined in Table 1. KNRK refers to a commercial rat kidney cell lysate, serving as a positive control. (B) Densitometric analysis of the Western blots of α-, β-, and γ-ENaC subunits. Values are shown as percentage of the density obtained from cells grown in medium 1 (all bars, n = 6). Medium 4 (⊠), medium 5 (formula image), and medium 6 (formula image).
Figure 7
Figure 7
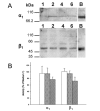
(A) Western blot of Na,K-ATPase-α1 and -β1 subunits in FDLE cells grown in the presence of different concentrations of E2 and P. B is the positive control obtained from rat brain tissue. (B) Densitometric analysis of the Western blots of Na,K-ATPase-α1 and -β1 subunits. Values are shown as percentage of the density obtained from cells grown in medium 1 (n = 6 for α1 and n = 10 for β1). Medium 2 (□), medium 4 (⊠), and medium 6 (formula image).

Similar articles

Cited by

References

    1. Matalon S, O'Brodovich H. Sodium channels in alveolar epithelial cells: molecular characterization, biophysical properties, and physiological significance. Annu Rev Physiol. 1999;61:627–661. doi: 10.1146/annurev.physiol.61.1.627. - DOI - PubMed
    1. Hummler E, Barker P, Gatzy J, Beermann F, Verdumo C, Schmidt A, Boucher R, Rossier BC. Early death due to defective neonatal lung liquid clearance in αENaC-deficient mice. Nat Genet. 1996;12:325–328. doi: 10.1038/ng0396-325. - DOI - PubMed
    1. Ware LB, Matthay MA. Alveolar fluid clearance is impaired in the majority of patients with acute lung injury and the acute respiratory distress syndrome. Am J Respir Crit Care Med. 2001;163:1376–1383. doi: 10.1164/ajrccm.163.6.2004035. - DOI - PubMed
    1. Barker PM, Gowen CW, Lawson EE, Knowles MR. Decreased sodium ion absorption across nasal epithelium of very premature infants with respiratory distress syndrome. J Pediatr. 1997;130:373–377. doi: 10.1016/S0022-3476(97)70198-7. - DOI - PubMed
    1. Helve O, Pitkanen OM, Andersson S, O'Brodovich H, Kirjavainen T, Otulakowski G. Low expression of human epithelial sodium channel in airway epithelium of preterm infants with respiratory distress. Pediatrics. 2004;113:1267–1272. doi: 10.1542/peds.113.5.1267. - DOI - PubMed

Publication types