. 2011 Jan 5;30(1):181-93.
doi: 10.1038/emboj.2010.285. Epub 2010 Nov 19.

CSN complex controls the stability of selected synaptic proteins via a torsinA-dependent process

Affiliations

CSN complex controls the stability of selected synaptic proteins via a torsinA-dependent process

Alessandra Granata et al. EMBO J. .

Abstract

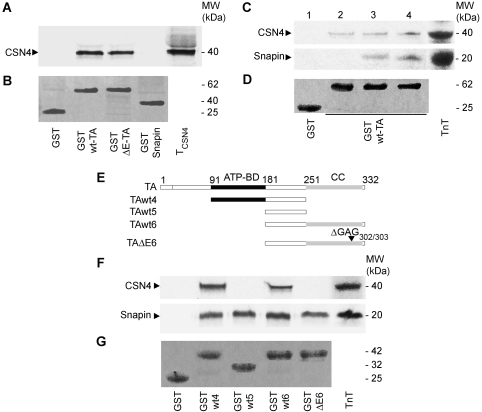
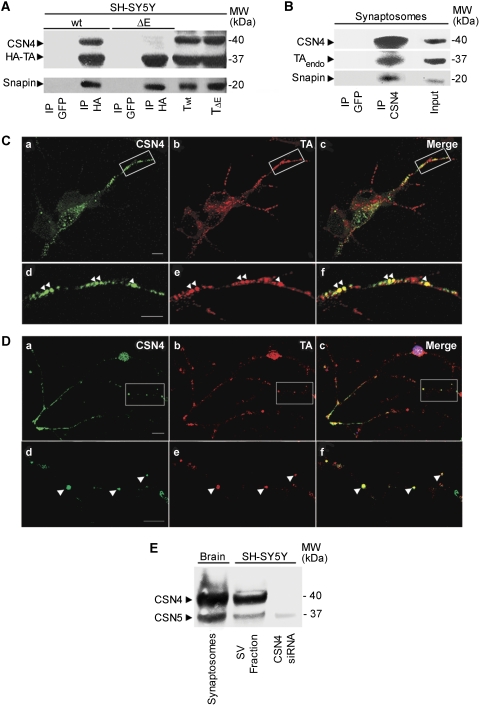
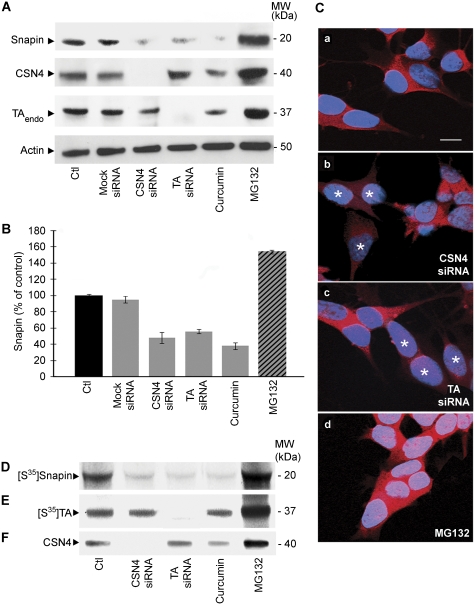
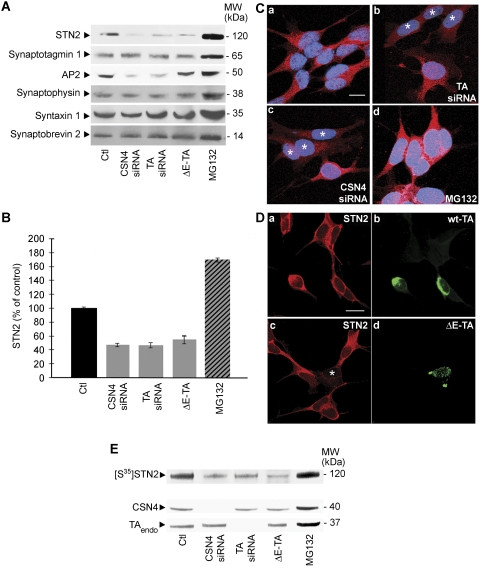
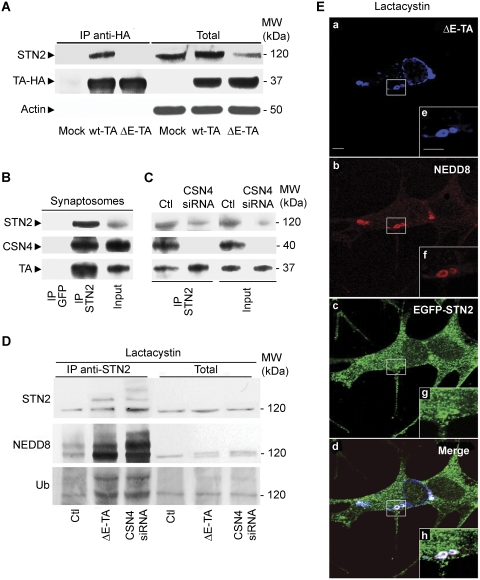
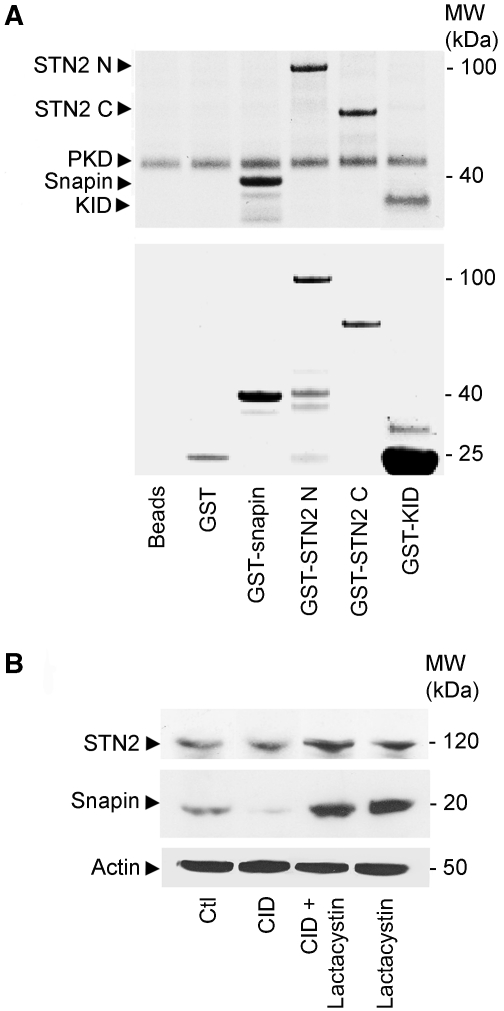
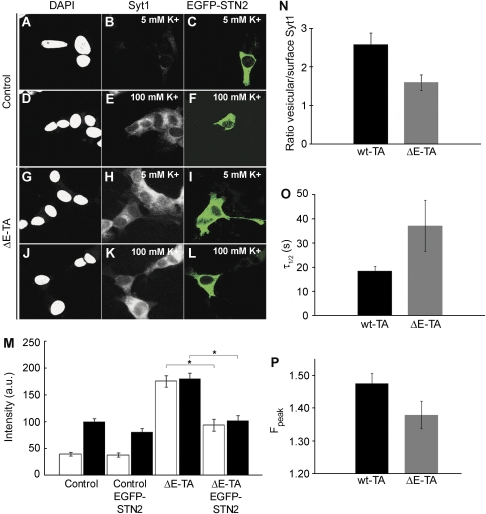
DYT1 dystonia is caused by an autosomal dominant mutation that leads to a glutamic acid deletion in torsinA (TA), a member of the AAA+ ATPase superfamily. In this study, we identified a novel-binding partner of TA, the subunit 4 (CSN4) of CSN signalosome. TA binds CSN4 and the synaptic regulator snapin in neuroblastoma cells and in brain synaptosomes. CSN4 and TA are required for the stability of both snapin and the synaptotagmin-specific endocytic adaptor stonin 2, as downregulation of CSN4 or TA reduces the levels of both proteins. Snapin is phosphorylated by the CSN-associated kinase protein kinase D (PKD) and its expression is decreased upon PKD inhibition. In contrast, the stability of stonin 2 is regulated by neddylation, another CSN-associated activity. Overexpression of the pathological TA mutant (ΔE-TA) reduces stonin 2 expression, causing the accumulation of the calcium sensor synaptotagmin 1 on the cell surface. Retrieval of surface-stranded synaptotagmin 1 is restored by overexpression of stonin 2 in ΔE-TA-expressing cells, suggesting that the DYT1 mutation compromises the role of TA in protein stabilisation and synaptic vesicle recycling.


Conflict of interest statement

The authors declare that they have no conflict of interest.

Figures

Figure 1
Figure 1
CSN4 and snapin bind TA independently. (A) GST pull downs using in vitro transcribed-translated CSN4 (TCSN4) labelled with [35S]-methionine show that both wt-TA and ΔE-TA bind CSN4, while snapin does not interact directly with CSN4. (B) The corresponding Coomassie Blue stained gel shows GST-wt-TA, GST-ΔE-TA, GST-snapin and GST bands. (C) CSN4 and snapin do not compete for binding on GST-wt-TA. Increasing quantities of snapin (2, no snapin; 3, half snapin; 4, equimolar CSN4 and snapin) were added to a [35S]-labelled in vitro transcription translation (TnT) mix containing a constant quantity of CSN4. (D) The corresponding Coomassie Blue stained gel shows GST-wt-TA and GST bands. (E) Schematic representation of the full-length and truncated versions of wt and mutant TA; ATP-BD, ATP-binding domain; CC, coiled-coil domain. The filled region (91–181) marks the position of the ATPase domain. ΔGAG302/303 indicates the position of the three base pair deletion. (F) GST pull downs with the truncated mutants of TA show that CSN4 interacts with both wt4 and wt6 mutants while no signal was detected for ΔE6. In a parallel experiment, snapin binds to all TA fragments. (G) The corresponding Coomassie Blue stained gel shows GST-TA-wt4, -wt5, -wt6 and -ΔE6, and GST used as control.
Figure 2
Figure 2
Endogenous CSN4 forms a complex with wt-TA and snapin in SH-SY5Y cells and brain synaptosomes. (A) Lysates of SH-SY5Y cells overexpressing HA-wt-TA or HA-ΔE-TA were incubated with either anti-HA or anti-GFP antibodies. Immunoprecipitated complexes (IP) were then analysed by western blot with specific antibodies against CSN4, snapin and HA tag. A triple complex containing CSN4, snapin and TA was observed in lysates expressing wt-TA. Lanes Twt and TΔE show 1/10th of the starting material. (B) A complex of endogenous CSN4, TA and snapin was detected in rat brain synaptosomes using a specific anti-CSN4 antibody for immunoprecipitation. Total lysate (input) consists of 1/10th of the starting material. (C) Immunofluorescence analysis of endogenous CSN4 and TA in SH-SY5Y cells. Both CSN4 (green; a, d) and TA (red; b, e) show a punctate pattern. A partial overlapping of CSN4 and TA is observed along neurites (c, f). Scale bar=5 μm (a–c) and 2 μm (d–f). (D) Immunofluorescence of CSN4 and TA in primary cerebellar granule neurons. CSN4 (green; a, d) and TA (red; b, e) co-localise along neurites (c, f). Scale bar=10 μm (a–c) and 3 μm (d–f). (E) The subunit 5 (CSN5) of CSN was also detected in the synaptic vesicle fraction (SV) of SH-SY5Y cells and in brain synaptosomes. Downregulation of CSN4 by siRNA destabilises CSN5.
Figure 3
Figure 3
Downregulation of CSN4 and TA affect snapin levels in SH-SY5Y cells. (A) Equal amount of lysates from untreated SH-SY5Y cells (Ctl), cells treated with mock siRNA, with specific siRNA to knockdown CSN4 (CSN4 siRNA) and TA (TA siRNA), with curcumin, a specific inhibitor for CSN and with the proteasome inhibitor MG132 were analysed by western blot and detected with specific antibodies. β-actin was used as loading control. (B) The amount of snapin from three independent experiments is shown. Snapin levels are drastically reduced in cells treated with siRNA against CSN4 and TA, or curcumin, while treatment with MG132 increases the amount of endogenous snapin. Error bars represent s.e.m. (C) The immunofluorescence signal for snapin (red) is unaffected by transfection with a control siRNA alone (a), whereas is decreased in cells transfected with CSN4 siRNA (b) and TA siRNA (c). Snapin is accumulated in cells after MG132 treatment (d). Stars indicate transfected cells. Scale bar=10 μm. (DF) Metabolic labelling of snapin in SH-SY5Y cells. Untreated cells (Ctl) and cells treated with siRNA against CSN4 or TA, curcumin and MG132 were incubated overnight with [35S]-methionine. After 2 h incubation with cycloheximide, cells were analysed by immunoprecipitation using a specific anti-snapin (D) or anti-TA antibody (E) and radioactive bands revealed by autoradiography. (F) CSN4 levels were monitored by western blot.
Figure 4
Figure 4
Stonin 2 levels are affected by ΔE-TA overexpression, and CSN4 and TA knockdown. (A) The amount of the synaptic markers stonin 2 (STN2), synaptotagmin 1, AP2, synaptophysin, syntaxin 1 and VAMP2/synaptobrevin 2 was analysed by western blot in control SH-SY5Y cells, cells treated with CSN4 or TA siRNAs and cells expressing ΔE-TA. Endogenous stonin 2 and AP2 levels were reduced after cells treatment with CSN4 and TA siRNAs. Lower levels of stonin 2 were also seen in ΔE-TA-expressing cells. The total amount of synaptic proteins was increased as a consequence of MG132 treatment. (B) Total expression level of stonin 2 from three independent experiments is shown. Stonin 2 is reduced in cells treated with siRNA against CSN4 and TA and in cells expressing ΔE-TA, whereas it is increased in cells treated with MG132. Error bars represent s.e.m. (C) Immunofluorescence analysis of stonin 2 (red) showed reduced signal in cells transfected with siRNAs directed against TA (b) and CSN4 (c) compared with those transfected with control siRNA (a). A higher stonin 2 signal was seen after MG132 treatment (d). Stars indicate transfected cells. Scale bar=10 μm. (D) Immunofluorescence analysis shows reduced signal for stonin 2 (c; red) in cell overexpressing ΔE-TA (d; green). No changes in stonin 2 levels (a) were seen in cells expressing wt-TA (b). Scale bar=10 μm. (E) Metabolic labelling of stonin 2 in SH-SY5Y cells. Untreated cells (Ctl), cells treated with siRNA against CSN4 (CSN4 siRNA), TA (TA siRNA), ΔE-TA cell line and cells treated with MG132 were incubated overnight with [35S]-methionine. After 2 h treatment with cycloheximide, cells were analysed by immunoprecipitation using an anti-stonin 2 antibody and radioactive bands were revealed by autoradiography. The quantification of the efficiency of CSN4 and TA knockdown is shown in Supplementary Figure 2.
Figure 5
Figure 5
Endogenous stonin 2 interacts with wt-TA and CSN4 and it is a potential target for CSN-mediated deneddylation. (A) Immunoprecipitation using an anti-HA antibody against HA-wt-TA and ΔE-TA overexpressed in SH-SY5Y cells shows that stonin 2 binds specifically wt-TA. Cells transfected with an empty vector were used as control (mock). Stonin 2 levels are reduced in cells overexpressing HA-ΔE-TA. β-actin was used as loading control. Lanes on the right (total) represent 1/10th of the starting material. (B, C) Stonin 2 forms a complex together with CSN4 and TA. Immunoprecipitation with a specific antibody against stonin 2 shows that it exists in a complex with TA and CSN4 in rat brain synaptosomes (B) and in SH-SY5Y cell lysates (C; Ctl). In cells in which CSN4 has been downregulated (CSN4 siRNA), stonin 2 still binds TA. Total lysates consist of 1/10th of the starting material. (D) Extracts from control (Ctl), ΔE-TA expressing and CSN4 knockdown (CSN4 siRNA) SH-SY5Y cells previously treated with lactacystin, a proteasome inhibitor, were immunoprecipitated with an anti-stonin 2 antibody and then blotted for stonin 2, NEDD8 and ubiquitin. Higher amount of neddylated and poly-ubiquitinated stonin 2 levels were recovered in ΔE-TA and CSN4 siRNA samples. The panel on the right shows 1/10th of the starting material. (E) Immunostaining with anti-NEDD8 (b; red) and anti-HA (a; blue) antibodies performed in ΔE-TA SH-SY5Y cells transfected with EGFP-STN2 (c; green) and pre-treated with lactacystin showed accumulation of EGFP-STN2 and NEDD8 in perinuclear ΔE-TA-positive inclusions (d; merge).
Figure 6
Figure 6
Snapin levels are affected by PKD inhibition. (A) Recombinant GST-snapin, GST-N-terminal (1–555 aa; GST-STN2 N) and C-terminal (557–898 aa; GST-STN2 C) domains of stonin 2 are phosphorylated in vitro by recombinant PKD. A fragment of Kidins220/ARMS (KID; 871–961 aa) containing the phosphorylation site for PKD (Ser919) was used as positive control. (B) SH-SY5Y cells were treated with a specific inhibitor for PKD (CID) alone or in combination with lactacystin, PKD inhibition decreases the cellular levels of snapin compared with untreated cells (Ctl), while the level of stonin 2 appeared unaffected. β-actin was used as loading control.
Figure 7
Figure 7
The accumulation of Syt1 on the surface of ΔE-TA-expressing cells is rescued by EGFP-stonin 2 overexpression. Control and ΔE-TA-expressing SH-SY5Y cells were transfected with EGFP-stonin 2 (EGFP-STN2; in green) and analysed for Syt1 recycling in resting (5 mM K+) and depolarising conditions (100 mM K+). In control cells expressing EGFP-stonin 2 (AF), the surface labelling for Syt1 increases in response to depolarisation (E, F) compared with resting conditions (B, C), similarly to untransfected control cells (EGFP negative; AF). In contrast, in cells co-expressing ΔE-TA and EGFP-stonin 2 (GL), the level of Syt1 on the cell surface is significantly reduced in resting cells (H, I) and depolarising conditions (K, L) compared with ΔE-TA-expressing cells. (M) Quantification of the intensity of anti-Syt1 antibody staining on the plasma membrane. Empty columns refer to resting condition (5 mM K+), whereas filled columns show the extent of Syt1 staining in depolarising condition (100 mM K+) (n=3). Error bars represent s.e. The asterisks indicate P<0.05 in Student's t-test. Scale bar=5 μm. (N) The vesicular-to-surface-stranded pool ratio of Syt1 was quantified in control wt-TA and ΔE-TA SH-SY5Y cells. Overexpression of ΔE-TA causes a decrease in the vesicular-to-surface pool ratio. Error bars represent s.e.m. (n=3; P<0.05 by Student's t-test). (O) wt-TA overexpressing neurons display faster retrieval of SytpHluorin when compared with ΔE-TA. Hippocampal neurons (DIV15) co-expressing SytpHluorin with wt- or ΔE-TA were stimulated with 200 APs at 20 Hz. Data are derived from the time course of normalised SytpHluorin fluorescence traces [(FF0)/(FpeakF0)]. Time constants (τ1/2±s.e.m.) for retrieval were 18.37 s±2.06 for wt-TA and 36.92 s±10.85 for ΔE-TA (n=2; 565 boutons for w-TA and 567 boutons for ΔE-TA; P<0.06 by Student's t-test). (P) Effects of TA expression on SytpHluorin exo-endocytosis. Hippocampal neurons (DIV 15) expressing wt-TA or ΔE-TA were stimulated with 200 APs (20 Hz) and exo-endocytosis was monitored by following the time course of SytpHluorin fluorescence. Peak values of SytpHluorin relative fluorescence are plotted. Peak values±s.e.m. for wt-TA and ΔE-TA were 1.48±0.03 and 1.38±0.04, respectively; P<0.04 by Student's t-test).

Similar articles

Cited by

References

    1. Balcioglu A, Kim MO, Sharma N, Cha JH, Breakefield XO, Standaert DG (2007) Dopamine release is impaired in a mouse model of DYT1 dystonia. J Neurochem 102: 783–788 - PubMed
    1. Bech-Otschir D, Kraft R, Huang X, Henklein P, Kapelari B, Pollmann C, Dubiel W (2001) COP9 signalosome-specific phosphorylation targets p53 to degradation by the ubiquitin system. EMBO J 20: 1630–1639 - PMC - PubMed
    1. Bech-Otschir D, Seeger M, Dubiel W (2002) The COP9 signalosome: at the interface between signal transduction and ubiquitin-dependent proteolysis. J Cell Sci 115: 467–473 - PubMed
    1. Bosu DR, Kipreos ET (2008) Cullin-RING ubiquitin ligases: global regulation and activation cycles. Cell Div 3: 7. - PMC - PubMed
    1. Breakefield XO, Kamm C, Hanson PI (2001) TorsinA: movement at many levels. Neuron 31: 9–12 - PubMed

Publication types

MeSH terms