. 2010 Dec;12(12):1154-65.
doi: 10.1038/ncb2119. Epub 2010 Nov 21.

Human IRGM regulates autophagy and cell-autonomous immunity functions through mitochondria

Affiliations

Human IRGM regulates autophagy and cell-autonomous immunity functions through mitochondria

Sudha B Singh et al. Nat Cell Biol. 2010 Dec.

Abstract

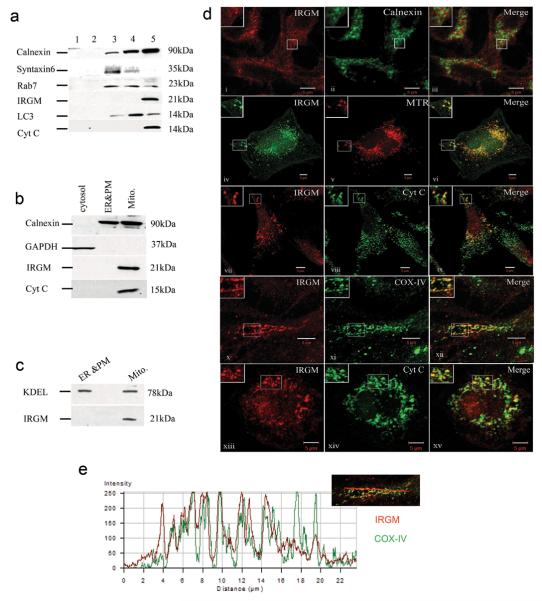
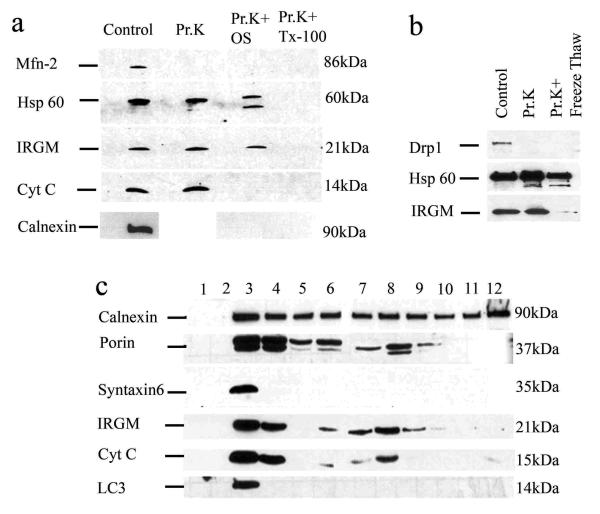
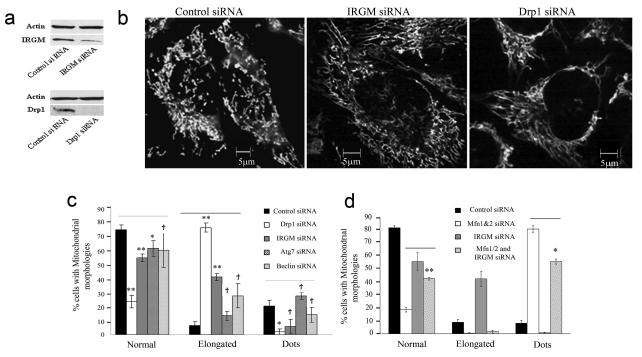
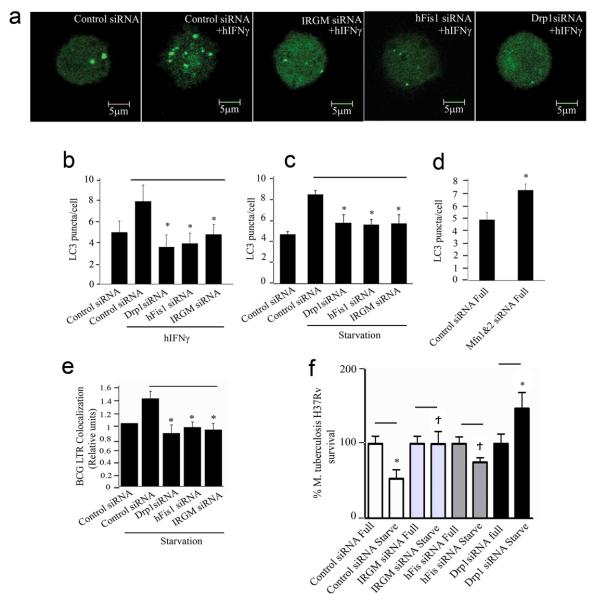
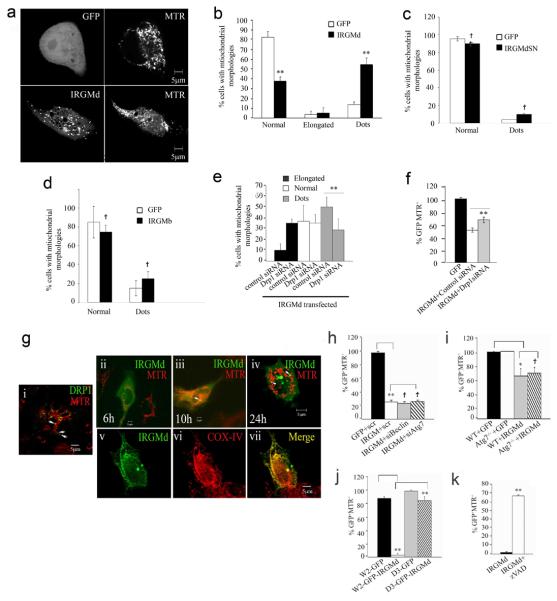
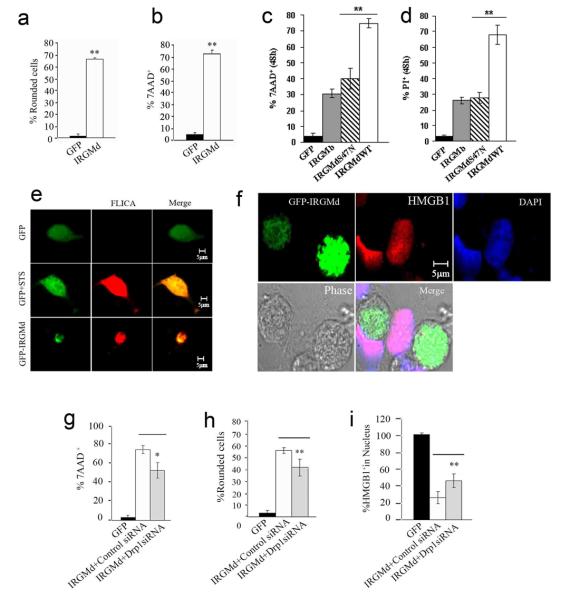
IRGM, a human immunity-related GTPase, confers autophagic defence against intracellular pathogens by an unknown mechanism. Here, we report an unexpected mode of IRGM action. IRGM demonstrated differential affinity for the mitochondrial lipid cardiolipin, translocated to mitochondria, affected mitochondrial fission and induced autophagy. Mitochondrial fission was necessary for autophagic control of intracellular mycobacteria by IRGM. IRGM influenced mitochondrial membrane polarization and cell death. Overexpression of IRGMd, but not IRGMb splice isoforms, caused mitochondrial depolarization and autophagy-independent, but Bax/Bak-dependent, cell death. By acting on mitochondria, IRGM confers autophagic protection or cell death, explaining IRGM action both in defence against tuberculosis and in the damaging inflammation caused by Crohn's disease.


Figures

Fig. 1
Fig. 1. IRGM localizes to mitochondria
a. Subcellular compartments (U937 cell extracts) were separated by sedimentation velocity on discontinuous sucrose gradient and probed for IRGM and indicated markers. b. Immunoblot analysis of mitochondria purified by Qproteome Mitochondria Isolation Kit (Qiagen). c. Analysis of KDEL vs IRGM distribution in fractions as in panel b. d. Intracellular localization of IRGM analyzed by confocal microscopy. Panels i-xi: Endogenous IRGM localization in HeLa cells relative to calnexin, Mitotracker Red (MTR), Cytochrome c, and COX IV. Panels xii-xiv: IRGM localization in primary human macrophages relative to mitochondria revealed with Cytochrome c antibody. e. analysis of IRGM (green) and COX IV (red) overlap along the line shown in the inset; the profiles correspond to panel ix.
Fig. 2
Fig. 2. IRGM co-fractionates with mitochondria and localizes to their inner membrane or matrix
a. Purified mitochondria were untreated or subjected to osmotic shock (OS), or total protein solubilized with TX-100, and preparations digested with Proteinase K (Pr.K) and analyzed by immunoblotting. b. Mitochondrial preparations as in e were subjected to membrane disruption by freeze-thaw cycles and accessibility of proteins to Proteinase K examined by digestion followed by immunobloting. c. Immunoblot analysis of membranous organelles from U937 cells separated by isopycnic sucrose density gradient centrifugation.
Fig. 3
Fig. 3. IRGM affects mitochondrial fission
a. Knockdowns of IRGM and DRP1; cells were transfected with control siRNA or with siRNA to IRGM and DRP1 for 48 h and protein samples were analyzed by Western blotting with anti-IRGM and anti-Drp1 antibodies. Actin, loading control. b. HeLa cells treated with siRNA to either IRGM or DRP1 were labeled with MTR and analyzed by live microscopy. c. Cells were treated with either control siRNA or with DRP1, IRGM, ATG7 or BECN1 (Beclin 1) siRNAs, labeled with MTR and the % of cells with mitochondrial morphologies ranging from normal, punctiform (dots) and elongated were quantified. Definition of mito-morphologies and quantification criteria are given in Suppl. Fig. S2 legend. d. Cells were transfected with either control siRNA or with siRNA to MFN1&2, IRGM or IRGM and MFN1&2, labeled with MTR and analyzed for mitochondrial morphologies. Data, means ± SEM (n=3 panel c, n=4 panel d).*P<0.05, **P<0.01, †P>0.05 (t-test).
Fig. 4
Fig. 4. Relationship between mitochondrial fission and autophagy and roles of IRGM, DRP1 and FIS1 in autophagic control of mycobacteria
a and b. (a) U937 cells were transfected with GFP-LC3 and siRNA to FIS1, DRP1, IRGM or control and autophagy was induced with hIFN-γ (300 u/ml) for 24 h, and (b) LC3 puncta per cell quantified. c. As in (b) except that autophagy was induced by starvation (4 h). d. LC3 puncta per cell were quantified in cells transfected with either control or MFN1&2 siRNA. e. siRNA treated cells were infected with BCG, autophagy induced by starvation and phagosome maturation \ analyzed using LysoTracker (LTR), as a reporter of acidification , . f siRNA treated U937 were infected with virulent M. tuberculosis H37Rv, autophagy induced by starvation (4 h) or kept in full medium. CFU were counted to assess bacterial survival. Data, means ± SEM (n=6; two independent transfections, 6 independent infections; SD values are given in Supplementary Table S1). *P<0.05, **P<0.01, †P>0.05 (t-test).
Fig. 5
Fig. 5. IRGMd binds to cardiolipin and causes loss of mitochondrial membrane potential
a. Splice variants of IRGM. G1-G5, GTPase motifs. The S47N mutation is indicated in blue. b. HeLa cells were transfected with IRGMb, IRGMd-WT (wild type IRGMd, unaltered) or IRGM-S47N mutant (SN) for 48 h, labeled with MTR and imaged by live microscopy. c. Fluorescence intensity analysis of green and red channels along a line drawn through two adjacent cells, one GFP-IRGMd positive and one GFP-IRGMd negative. d. Quantification of GFP+MTR+ cells. e,f. Analysis of GST-IRGMd binding to lipids by lipid protein binding dot blots (e) and cardiolipin bound agarose bead pull down assay (f; details in Methods). g. IRGMd, IRGMdS47 mutant, and IRGMb isoform concentration-dependent analysis of binding to lipids on strip blots (numbers identifying lipids correspond to the legend in panel e). GST control is in Suppl. Fig. S1d. Membranes in e-g were probed with anti-GST antibody.
Fig. 6
Fig. 6. IRGMd translocates to mitochondria, induces mitochondrial fragmentation and causes loss of mitochondrial Δψm independent of autophagic but dependent on apoptotic machinery
a. HeLa cells transfected with GFP or GFP-IRGMd for 24 h were stained with MTR and imaged. b-d. Quantification of mitochondrial morphologies in cells transfected with IRGMd, IRGMdS47N, or IRGMb fusions. e,f. IRGM acts in concert with DRP1. Cells were transfected with siRNAs (48 h) and GFP-IRGMd, and mitochondrial morphologies (e; 24 h) or MTR staining (f; % of GFP+ cells that were also MTR+ at 48 h) quantified. g. IRGMd translocates (ii-iv) from the cytosol to mitochondria and colocalizes with COX IV (v-vii). Cytosol-to-mitochondria translocation and mitochondrial localization was compared with the typical appearance of steady state Drp1 distribution (i). h. HeLa cells, co-transfected with GFP-IRGMd and control, BECN1 (Beclin 1) or ATG7 siRNA, were labeled with MTR 48 h post-transfection, imaged by live microscopy, and % of GFP+ cells that were MTR+ quantified. i. Atg7 wild type (WT) or Atg7−/− MEF transfected with GFP-IRGMd for 48 h were analyzed for mitochondrial staining as in g. j. Wild type W2 (Bax/Bak+/+) or mutant D3 (Bax/Bak−/−) BMK cells were transfected with GFP-IRGMd for 48 h and % of GFP+ cells that were MTR+ quantified. k. HeLa cells were transfected with GFP-IRGMd, treated with z-VAD, and after 48 h stained with MTR. Data, means ± SEM (n=3). †P≥0.05,*P<0.05, **P<0.01, (t-test).
Fig. 7
Fig. 7. IRGMd induces cell death
a. Fraction (%) of HeLa cells transfected with GFP or GFP-IRGMd that were rounded 48 h post-transfection. b. HeLa cells transfected with GFP or GFP-IRGMd for 48 h were stained with 7-AAD and % of GFP+ cells that were 7-AAD+ quantified. c. Comparison of 7-AAD staining in cells transfected with IRGMd vs. IRGMDS47N mutant and IRGMb (expressed as fluorescent protein fusions). d. Comparison of propidium iodide staining in cells transfected with IRGMd vs. IRGMDS47N mutant and IRGMb (expressed as fluorescent protein fusions). e. GFP-IRGMd transfected cells were stained for active caspases 3 and 7 using FLICA dye (Serotec). Staurosporine was used as a positive control. f. GFP-IRGMd transfected cells were immunostained for HMGB1 (absence of nuclear HMGB1 stain is a marker of HMGB1 release). g-i. Cells were transfected for 48 h with GFP or IRGMd plus control or DRP1 siRNA, and % of 7-AAD+ cells (g), rounded cells (h) and cells with HGMB1+ nuclei quantified. Data, means ± SEM (n=3). *P<0.05, **P<0.01 (t-test).
Fig. 8
Fig. 8. Comparison of IRGMa, b and c effects
HeLa cells were transfected with GFP, IRGMa, IRGMc or IRGMd for 24 h (a) or 48 h (b), stained with Mitotracker Red, and % of GFP+ that were also MTR+ cells quantified. c and d. % of IRGMa, IRGMc, IRGMd or GFP transfected cells that were rounded 24 h and 48 h after transfection. e and f. Cells were transfected with IRGMa, c or d isoforms for 24 h (e) or 48 h (f), labeled with 7-AAD and % of GFP+ cells that were 7-AAD+ determined. g and h. Cells transfected with indicated plasmids for 24 h (g) or 48 h (h) were processed by immunofluorescence to assess retention of HGMB1 in the nucleus. Data, means ± SEM (n=3 a-f; n=4 g,h). *P<0.05, **P<0.01 (t-test).

References

    1. Mizushima N, Levine B, Cuervo AM, Klionsky DJ. Autophagy fights disease through cellular self-digestion. Nature. 2008;451:1069–1075. - PMC - PubMed
    1. Kundu M, Thompson CB. Autophagy: basic principles and relevance to disease. Annu Rev Pathol. 2008;3:427–455. - PubMed
    1. Mathew R, Karantza-Wadsworth V, White E. Role of autophagy in cancer. Nat Rev Cancer. 2007;7:961–967. - PMC - PubMed
    1. Kroemer G, Levine B. Autophagic cell death: the story of a misnomer. Nat Rev Mol Cell Biol. 2008;9:1004–1010. - PMC - PubMed
    1. Berry DL, Baehrecke EH. Growth arrest and autophagy are required for salivary gland cell degradation in Drosophila. Cell. 2007;131:1137–1148. - PMC - PubMed

Publication types