. 2010 Dec;12(12):1133-42.
doi: 10.1038/ncb2124. Epub 2010 Nov 21.

Tissue elongation requires oscillating contractions of a basal actomyosin network

Affiliations

Tissue elongation requires oscillating contractions of a basal actomyosin network

Li He et al. Nat Cell Biol. 2010 Dec.

Abstract

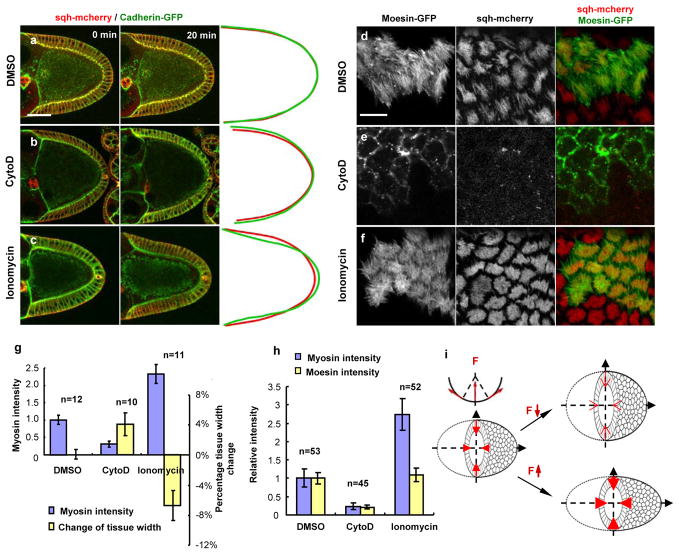
Understanding how molecular dynamics leads to cellular behaviours that ultimately sculpt organs and tissues is a major challenge not only in basic developmental biology but also in tissue engineering and regenerative medicine. Here we use live imaging to show that the basal surfaces of Drosophila follicle cells undergo a series of directional, oscillating contractions driven by periodic myosin accumulation on a polarized actin network. Inhibition of the actomyosin contractions or their coupling to extracellular matrix (ECM) blocked elongation of the whole tissue, whereas enhancement of the contractions exaggerated it. Myosin accumulated in a periodic manner before each contraction and was regulated by the small GTPase Rho, its downstream kinase, ROCK, and cytosolic calcium. Disrupting the link between the actin cytoskeleton and the ECM decreased the amplitude and period of the contractions, whereas enhancing cell-ECM adhesion increased them. In contrast, disrupting cell-cell adhesions resulted in loss of the actin network. Our findings reveal a mechanism controlling organ shape and an experimental model for the study of the effects of oscillatory actomyosin activity within a coherent cell sheet.


Figures

Figure 1
Figure 1. Stage 9 follicle cells undergo rapid, periodic contractions and myosin accumulation
a. Surface view of a live, late stage 9 egg chamber expressing Sqh-mcherry (red) and Cadherin-GFP (green). b. A sagittal plane through the center of the egg chamber. c, d. The Sqh-mcherry label alone. Scale bar is 50μm. e. Schematic drawings of egg chambers in (a) and (b), and the imaging of the apical and basal regions of the follicle cells. The red box at the left panel indicates a typical field of cells. The blue and red boxes indicate the basal and apical focal planes, respectively. f–k. Images of late stage 9 egg chamber expressing Sqh-mcherry (red) and Cadherin-GFP (green) at apical and basal focal planes, scale bar is 20μm. l–n. Time-lapse series of one representative oscillating cell labeled with Cadherin-GFP (i) and Sqh-mcherry (n). The digitized cell contour is color coded based on the percentage of surface area reduction relative to the maximum area captured during imaging as indicated in the heat map (m). Scale bar is 10μm. The A-P and D-V orientation is shown on the right.
Figure 2
Figure 2. Quantification of basal periodic contraction and comparison with apical activity
a. Dynamic change of basal area, D-V and A-P cell length from one representative cell. Peaks are indicated by arrowheads of the corresponding color. b. The distribution of periods observed over 375 oscillations with mean at 6.3 min and standard deviation (s.d.) of 1.2 min. c. Change of apical area and apical myosin intensity from one representative cell over time. d. Calculated surface area change for the indicated numbers (n) of cells over 30 min of imaging. e. Calculated ratio of D-V to A-P length change over time. n is the number of individual cells analyzed. f. Changes of apical and basal myosin intensity compared with the average intensity for each, over the time course. n is the number of individual cells analyzed. g. The rate of change of myosin intensity (blue) and rate of reduction of basal area (purple) from the same sample. Peaks are marked with arrowheads. h. Autocorrelation of time sequences of apical (red) and basal (blue) myosin intensity. All error bars indicate ± standard deviation.
Figure 3
Figure 3. Accumulation of basal myosin on stable actin filaments precedes the basal membrane contraction
a, b. Confocal micrographs of a clone of Moesin-GFP in Sqh-mcherry expressing cells. Images in a and b were taken 3 minutes apart. Myosin intensity changes in two cells (left panel, arrows) whereas Moesin-labeled F-actin does not change detectably. Scale bar is 10μm. c. Quantification of the dynamic change of Moesin-GFP and Sqh-mcherry intensity in one oscillating cell. Intensity of each channel was normalized to its mean. d. Correlation between the rate of basal area reduction and myosin intensity change e. and Correlation between the rate of basal area reduction and moesin intensity. Each row shows the correlation from a different cell as a function of various time offsets. f. Average of all correlation coefficients with different time offsets. The red line shows the average time-dependent correlation between area reduction rate and myosin intensity rate from 43 individual cells. The blue line shows the average time-dependent correlation between moesin and myosin intensity from 37 individual cells. The correlation between the rate of basal area reduction and myosin accumulation reaches maximum at −1 min, suggesting that myosin accumulation precedes area reduction. In contrast, the correlation between myosin intensity and F-actin intensity peaks at 0, indicating that they are virtually simultaneous. g. The position of maximum correlation between contraction rate and intensity change rate (blue) is significantly different from zero with p<0.001, while the moesin and myosin correlation (red) is not. Error bars indicate ±s.d. h. The basal areas of cells (n=45) were calculated and averaged. Even though the basal areas of individual cells fluctuated periodically, the average basal area did not change because the fluctuations were temporary and unsynchronized. i. The ratio of A-P to D-V cell lengths during the time of imaging. n=45. The periodic changes observed in individual cells were neither synchronous nor lasting, therefore no change was detected on average. j. Diagram of different organizations and dynamics of the apical actomyosin for cells undergoing apical constriction vs. the basal actomyosin for cells undergoing basal oscillations.
Figure 4
Figure 4. Global change of basal myosin during egg chamber development
a. Schematic drawings of egg chambers at indicated developmental stages. Red shading illustrates the overall distribution of cells with periodic myosin accumulation. Anterior is to the left. b–e. Live egg chambers expressing Sqh-mcherry and Cadherin-GFP at early stage 9 (b), middle stage 9 (c), stage 10A (d), and stage 10B (e). Scale bar is 50μm. f. Basal myosin intensity relative to stage 8 and ratio of A-P to D-V egg chamber length at different stages. A-P or D-V length was defined as the maximum distance between two points of the tissue in corresponding direction. g–j. Side views of follicle cells from egg chambers of the indicated stages show the increase of basal myosin and comparatively constant apical myosin through development. Arrows indicate sites of basal myosin accumulation. Scale bar is 15 μm. k. Apical myosin intensity normalized to stage 8 and the ratio of basal myosin intensity (in cells that exhibit basal myosin accumulation) to apical myosin in the indicated number (n) of cells from stages 8 to 10.
Figure 5
Figure 5. Basal actomyosin contractions control tissue shape
a–c. Confocal micrographs of egg chambers treated with vehicle (DMSO), cytoclasin D (CytoD), or ionomycin at 0 min (the beginning of imaging) and 20 min. Tissue contours at the two time points are outlined in red (0 min) and green (20 min) lines. Scale bar is 50 μm. Control experiments and combination effects are shown in Supplementary Information, Fig. S3h-q. d–f. Live images of basal F-actin (labeled with Moesin-GFP) and myosin (Sqh-mcherry) after 30 min treatment with DMSO, CytoD or ionomycin. Scale bar is 10μm. Over 80% reduction of basal Moesin-GFP signal after CytoD treatment (e) suggested the majority GFP intensity represents F-actin. Ionomycin showed little or no effect on basal F-actin (f). Treatment with ROCK and calcium inhibitors reduced myosin intensity to near background but had little effect on actin (Supplementary Information, Fig. S3a–c), suggesting that the formation of basal actin and myosin contractile fibers is regulated independently. g. Average basal myosin intensity and the percentage change of egg chamber width during the 20 min imaging time following treatment with the indicated drugs. n is the number of the samples analyzed. h. Quantification of basal Moesin-GFP and myosin intensity after treatment with the indicated drugs. n is the number of cells analyzed. All error bars indicate ±s.d. i. An illustration of the proposed mechanism by which follicle cell relaxation or contraction leads to tissue rounding or elongation. Due to curvature of the egg chamber, contractile force (F) generated at the basal side is exerted in part toward the center. The red arrowheads indicate different magnitudes of contractile forces.
Figure 6
Figure 6. Rho, ROCK and cell adhesion regulate basal myosin accumulation and organ shape
a–h. Basal view of follicle cell clones expressing the indicated transgenes, marked by coexpression of either nlsGFP or mCD8GFP. Scale bar is 20μm. i. Quantification of relative basal and apical myosin intensity in the indicated number (n) of GFP positive cells compared with wild type cells in the same sample. Corresponding apical myosin and apical and basal actin images are shown in Supplementary Information, Fig. S4, S5. Verification of RNAi knock-down and over-expression are shown in Supplementary Information, Fig. S6. j–q. Morphology of stage 10B (j, l, n, p) and stage 14 (k, m, o, q) egg chambers expressing the indicated transgene in all follicle cells. Egg chambers expressing hsGal4 served as controls. Scale bar is 50 μm. r. Quantification of the A-P vs D-V length ratio at stage10B and 14 egg chambers with indicated genetic backgrounds. n is the number of samples analyzed. In contrast, no significant difference was observed at late stage 8 (Supplementary Information, Fig. S7). All error bars are ±s.d.
Figure 7
Figure 7. Cell autonomy of myosin oscillation and pathways affecting its magnitude and period
a, b. Confocal micrographs of follicle cell clones in living egg chambers expressing Sqh-mcherry. a. Wild type (WT, GFP-negative) cells adjacent to cells expressing ROCK RNAi (GFP-positive) are indicated by white arrows. WILD TYPE cells without any contact with ROCK RNAi-expressing cells are indicated by blue arrows. Scale bar is 10μm. b. Wild type (WT, GFP-negative) cells adjacent to cells expressing RhoV14 (GFP-positive) are indicated by white arrows. A wild type cell without any contact with RhoV14 -expressing cells is identified by a blue arrow. c, d. Quantification of myosin intensity and oscillation period in wild type cells that neighbor mutant cells showed no significant difference from wild type cells that did not neighbor mutant cells. n is the number of individual cell analyzed. e. Basal myosin intensity and oscillation period after addition of different concentrations of EGTA together with 2.5 μM ionomycin. 48 individual cells were analyzed covering ~150 periods. f. Basal myosin intensity and oscillation period after treatment with various concentrations of the ROCK inhibitor Y-27632. 37 cells were analyzed covering ~110 periods. g. Plot of oscillation period vs basal myosin intensity in wild type egg chambers. Samples were collected from 65 individual cells covering more than 200 periods. h. Dynamics of basal myosin intensity in a representative individual cell expressing UAS-talin RNAi, UAS- paxillin, or no UAS transgene (WT). i. The autocorrelation with different time offsets from data in (h). The first peak for each line provides the period for the corresponding genotype. j. Quantification of the effect on period. n is the number of cells from three independent clones analyzed. All error bars indicate ±s.d.
Figure 8
Figure 8
Model of tissue elongation controlled by basal actomyosin contraction Schematic representation of the distribution of molecules controlling oscillating basal contraction in an individual follicle cell and the organization of contractile forces into a super cellular band within the epithelium. Forces are indicated by red arrows. Local contraction force generated by basal myosin (red) transmitted through adhesions (blue) to the basal lamina (cyan) constrains tissue growth to the poles. Micrographs show a corresponding section through the middle of a stage 10 egg chamber labeled with cadherin-GFP;sqh-mcherry. The sqh-mcherry channel only is shown in black and white.

References

    1. Lecuit T, Lenne PF. Cell surface mechanics and the control of cell shape, tissue patterns and morphogenesis. Nat Rev Mol Cell Biol. 2007;8:633–44. - PubMed
    1. Mammoto T, Ingber DE. Mechanical control of tissue and organ development. Development. 2010;137:1407–20. - PMC - PubMed
    1. Martin AC, Kaschube M, Wieschaus EF. Pulsed contractions of an actin-myosin network drive apical constriction. Nature. 2009;457:495–9. - PMC - PubMed
    1. Solon J, Kaya-Copur A, Colombelli J, Brunner D. Pulsed forces timed by a ratchet-like mechanism drive directed tissue movement during dorsal closure. Cell. 2009;137:1331–42. - PubMed
    1. Bertet C, Sulak L, Lecuit T. Myosin-dependent junction remodelling controls planar cell intercalation and axis elongation. Nature. 2004;429:667–71. - PubMed

Publication types