. 2011 Jan;8(1):80-4.
doi: 10.1038/nmeth.1537. Epub 2010 Nov 21.

Protein localization in electron micrographs using fluorescence nanoscopy

Affiliations

Protein localization in electron micrographs using fluorescence nanoscopy

Shigeki Watanabe et al. Nat Methods. 2011 Jan.

Abstract

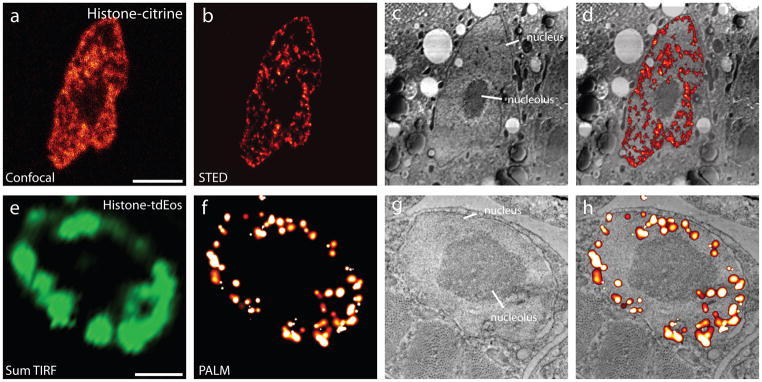
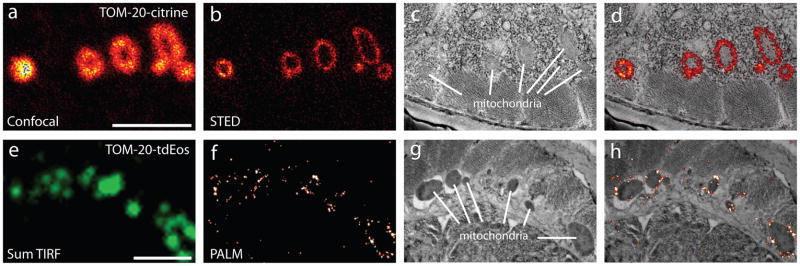
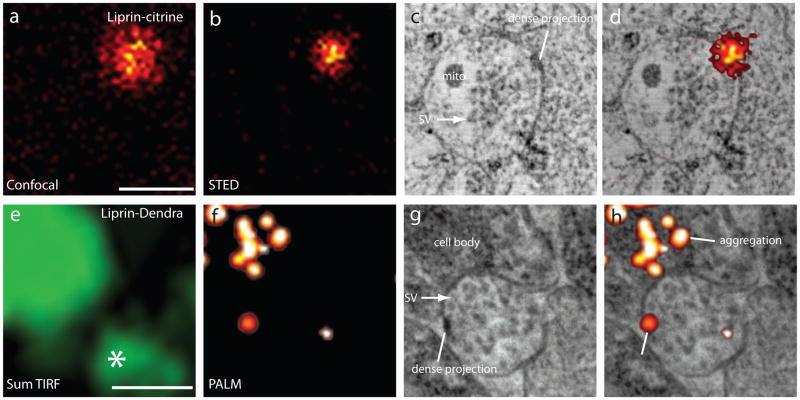
A complete portrait of a cell requires a detailed description of its molecular topography: proteins must be linked to particular organelles. Immunocytochemical electron microscopy can reveal locations of proteins with nanometer resolution but is limited by the quality of fixation, the paucity of antibodies and the inaccessibility of antigens. Here we describe correlative fluorescence electron microscopy for the nanoscopic localization of proteins in electron micrographs. We tagged proteins with the fluorescent proteins Citrine or tdEos and expressed them in Caenorhabditis elegans, fixed the worms and embedded them in plastic. We imaged the tagged proteins from ultrathin sections using stimulated emission depletion (STED) microscopy or photoactivated localization microscopy (PALM). Fluorescence correlated with organelles imaged in electron micrographs from the same sections. We used these methods to localize histones, a mitochondrial protein and a presynaptic dense projection protein in electron micrographs.


Figures

Figure 1
Figure 1
Correlative fluorescence and electron microscopy using Histone fusion proteins. (a) Confocal image of Histone-Citrine acquired from a thin section (120 nm). (b) Corresponding STED image of Histone-Citrine. (c) Electron micrograph of an intestinal cell nucleus acquired from the same section. (d) Correlative STED and electron microscopy of Histone-Citrine. (e) Sum TIRF image of Histone-tdEos acquired from a thin section (70 nm). Sum TIRF image represents all the photons detected by the camera during the experimental time course. (f) Corresponding PALM image of Histone-tdEos. (g) Electron micrograph of a muscle cell nucleus acquired from the same section. (h) Correlative PALM and electron microscopy of Histone-tdEos. Scale bars, 3 μm (a-d) and 1 μm (e-h).
Figure 2
Figure 2
Correlative fluorescence and electron microscopy using TOM-20 fusion proteins. (a) Confocal image of TOM-20-Citrine acquired from a thin section (120 nm). (b) Corresponding STED image of TOM-20-Citrine. (c) Electron micrograph of a body wall muscle acquired from the same section. (d) Correlative STED and electron micrographs of TOM-20-Citrine. (e) Sum TIRF image of TOM-20-tdEos acquired from a thin section (70 nm) of an LR White-embedded sample. (f) Corresponding PALM image of TOM-20-tdEos. (g) Electron micrograph of a body wall muscle acquired from the same section. (h) Correlative PALM and electron microscopy of TOM-20-tdEos. Note that PALM images of TOM-20-tdEos are from tissue embedded in LR White; all other samples are in GMA. Scale bars, 1 μm (a-d) and 2 μm (e-h).
Figure 3
Figure 3
Correlative fluorescence and electron microscopy using liprin fusion proteins. (a) Confocal image of Liprin-Citrine acquired from a thin section (70 nm). (b) Corresponding STED image of Liprin-Citrine. (c) Electron micrograph of neurons in the nerve ring acquired from the same section. (d) Correlative STED and electron microscopy of Liprin-Citrine. The fluorescent signals are localized to the presynaptic dense projection. (e) Sum TIRF image of Liprin-Dendra acquired from a thin section (70 nm). * represents a region of predominant background signal, which was discarded by emission time threshold. (f) Corresponding PALM image of Liprin-Dendra. (g) Electron micrograph of neurons from the head ganglion region acquired from the same section. (h) Correlative PALM and electron microscopy of Liprin-Dendra. The fluorescent signals are localized to the presynaptic dense projection. Aggregrations of the overexpressed liprin also appears in the cell bodies. ‘mito’, mitochondrion.; ‘SV’, synaptic vesicle. Scale bars, 500 nm (a-h).

References

    1. Cox G, Sheppard CJ. Practical limits of resolution in confocal and non-linear microscopy. Microscopy Research and Technique. 2004;63:18–22. - PubMed
    1. Hell SW. Far-field optical nanoscopy. Science. 2007;316:1153–1158. - PubMed
    1. Hell SW, Wichmann J. Breaking the diffraction resolution limit by stimulated emission: stimulated-emission-depletion fluorescence microscopy. Opt Lett. 1994;19:780–782. - PubMed
    1. Klar TA, Jakobs S, Dyba M, Egner A, Hell SW. Fluorescence microscopy with diffraction resolution barrier broken by stimulated emission. Proc Natl Acad Sci USA. 2000;97:8206–8210. - PMC - PubMed
    1. Betzig E, et al. Imaging Intracellular Fluorescent Proteins at Nanometer Resolution. Science. 2006;313:1642–1645. - PubMed

Publication types

MeSH terms

LinkOut - more resources