. 2010 Dec;28(12):1279-85.
doi: 10.1038/nbt.1711. Epub 2010 Nov 21.

Large-scale in silico modeling of metabolic interactions between cell types in the human brain

Affiliations

Large-scale in silico modeling of metabolic interactions between cell types in the human brain

Nathan E Lewis et al. Nat Biotechnol. 2010 Dec.

Abstract

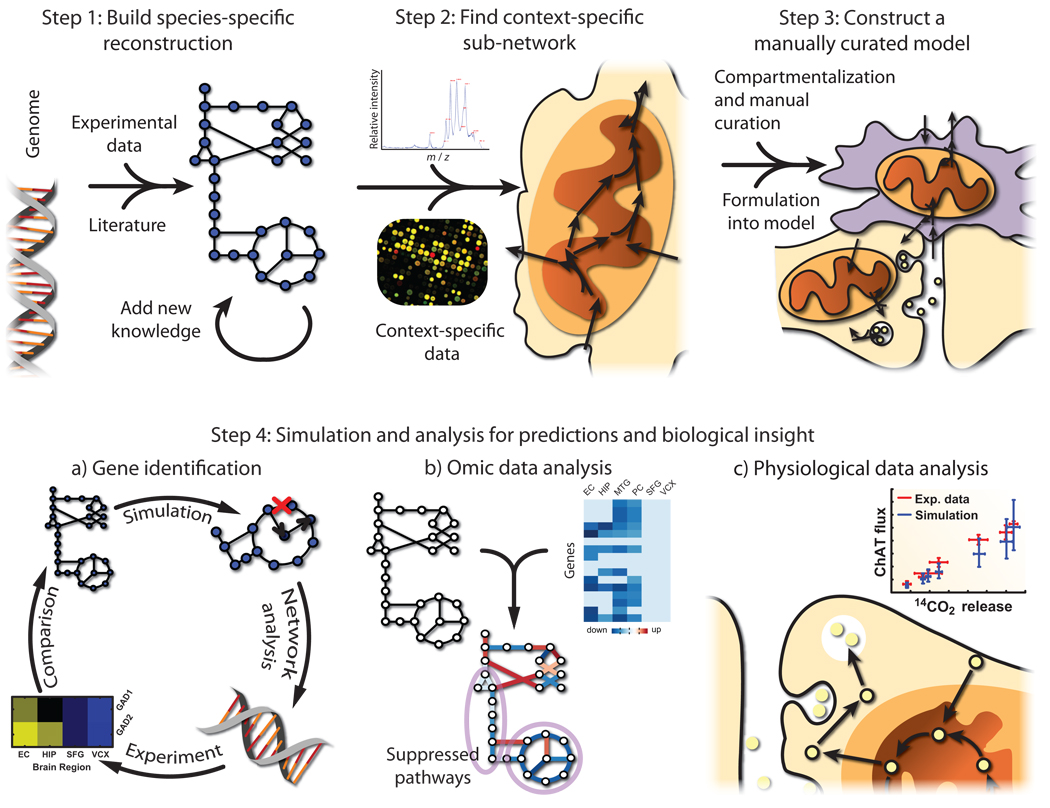
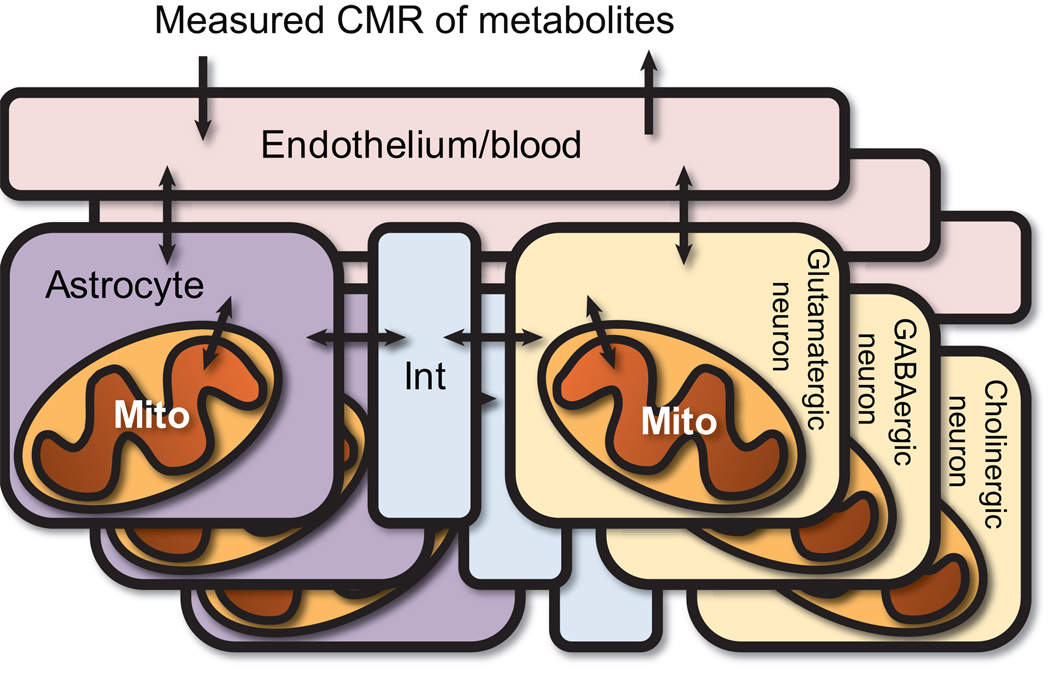
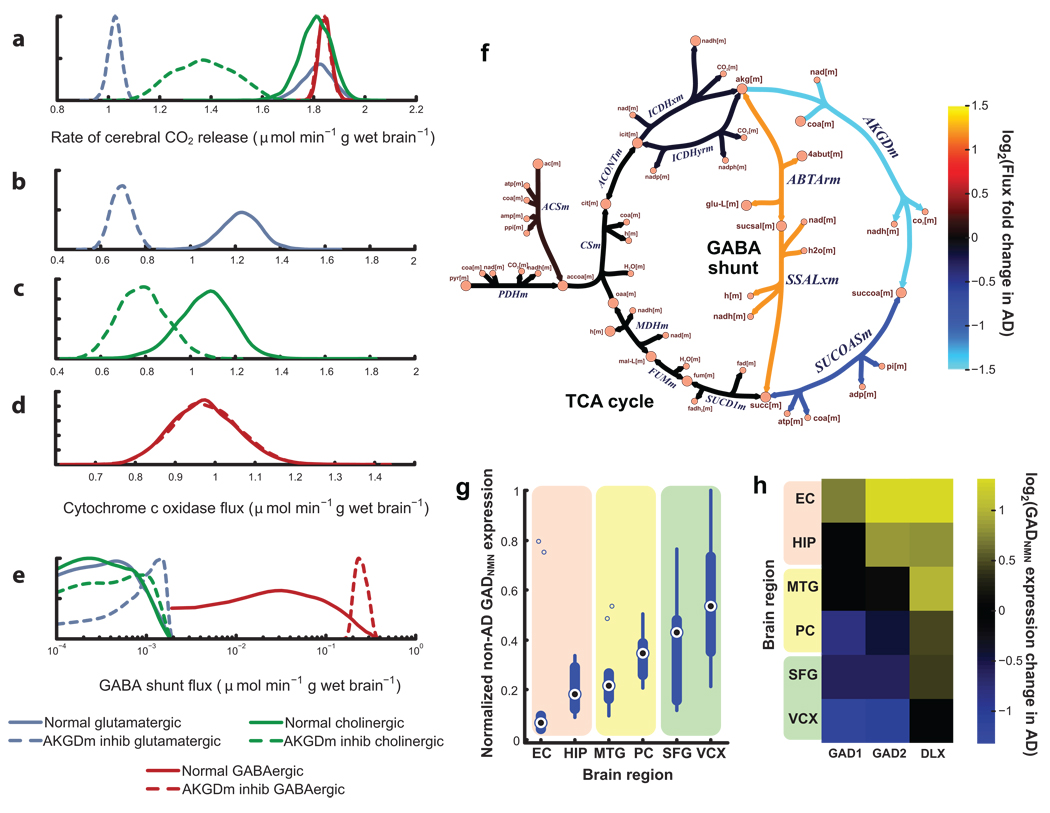
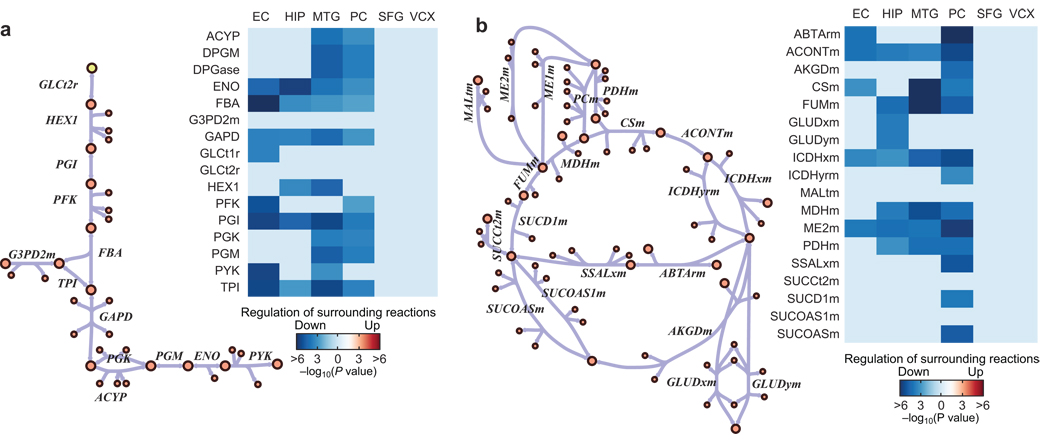
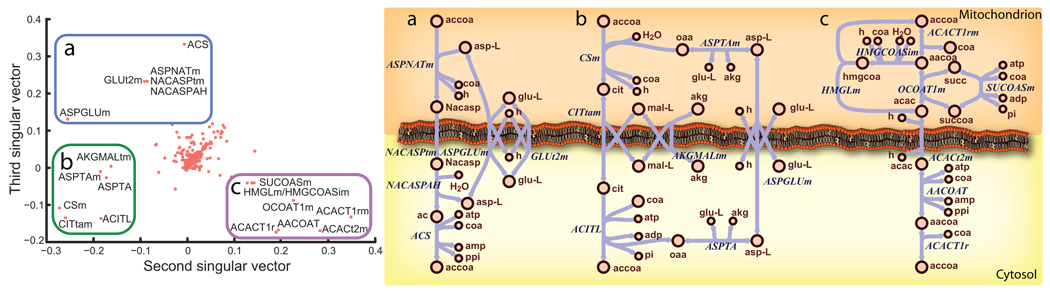
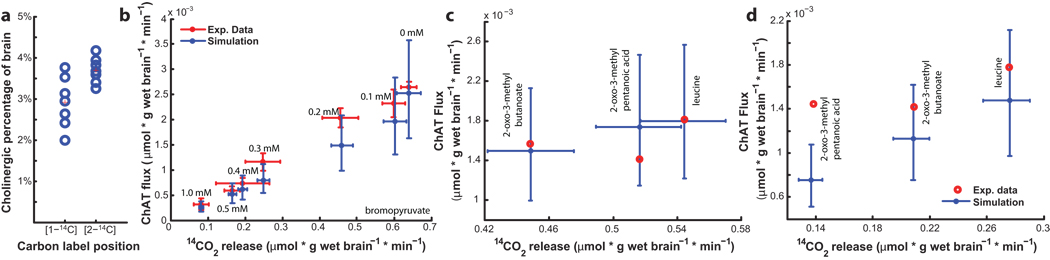
Metabolic interactions between multiple cell types are difficult to model using existing approaches. Here we present a workflow that integrates gene expression data, proteomics data and literature-based manual curation to model human metabolism within and between different types of cells. Transport reactions are used to account for the transfer of metabolites between models of different cell types via the interstitial fluid. We apply the method to create models of brain energy metabolism that recapitulate metabolic interactions between astrocytes and various neuron types relevant to Alzheimer's disease. Analysis of the models identifies genes and pathways that may explain observed experimental phenomena, including the differential effects of the disease on cell types and regions of the brain. Constraint-based modeling can thus contribute to the study and analysis of multicellular metabolic processes in the human tissue microenvironment and provide detailed mechanistic insight into high-throughput data analysis.


Figures

Figure 1
Figure 1. A workflow for bridging the genotype-phenotype gap with the use of high-throughput data and manual curation for the construction of multicellular models of metabolism
Metabolic models of multicellular tissues can be constructed to gain insight into biology and make testable hypotheses. First, a species-specific reconstruction is built based on genome annotation, experimental data, and knowledge obtained from the literature. Second, high-thoughput data can be mapped to the reconstruction in order to find a context-specific network (e.g., representing a tissue). Third, multicellular models are constructed as the context-specific network is organized into compartments representing different cell types, based on cell-specific knowledge and data. These networks are linked together with the transport of shared metabolites, and then formulated into a model. Fourth, the models are utilized for simulation and analysis to gain insight and generate testable hypotheses. For example, the models can be used to a) predict disease-associated genes, such as glutamate decarboxylase in this work. b) High-thoughput data can be analyzed in the network context to identify sets of genes that change together and affect specific pathways, such as the brain-region-specific suppression of central metabolism in Alzheimer’s disease patients. c) Physiological data can be analyzed in the context of the model, therefore allowing, for example, the calculation of the percentage of the brain that is cholinergic.
Figure 2
Figure 2. General structure of the models
Three models were built from the brain reconstruction. Each model consists of various compartments: 1) the endothelium/blood, 2) astrocytes, 3) astrocytic mitochondria, 4) neurons, 5) neuronal mitochondria, and 6) an interstitial space between the cell types. Each neuron metabolic network was tailored to represent a specific neuron type, containing genes and reactions generally accepted to be unique to the neuron type. Mito = mitochondrion, Int = interstitial space, CMR = cerebral metabolic rate.
Figure 3
Figure 3. Decrease in α-ketoglutarate dehydrogenase (AKGDm) activity, associated with Alzheimer’s disease (AD), shows cell-type and regional effects in silico consistent with experimental data
Kernel density plots show the distribution of feasible fluxes for various reactions (a–e). An in silico reduction of AKGDm flux from normal activity (a–e, solid lines) to AD brain activity (a–e, dashed) decreases (a) the oxidative metabolic rate for glutamateric and cholinergic neurons, but not GABAergic neurons. This results from a decrease in the feasible fluxes for oxidative phosphorylation (e.g., cytochrome c oxidase) for both (b) glutamatergic and (c) cholinergic neurons, but not (d) GABAergic cells. This cell-type-specific protection from the AKGDm deficiency results from (e) an increased flux through the GABA shunt in GABAergic cells, by bypassing the damaged AKGDm (f). GABAergic cells maintain a higher GABA shunt flux because of the expression of glutamate decarboxylase (GAD). Neuroprotective properties of GAD are supported by gene expression. (g) Severely damaged brain regions in AD patients have lower GADNMN expression in control brain, while high GADNMN regions (SFG and VCX) show little damage. In AD brain, (h) severely affected regions (HIP and EC) show an increase in GADNMN and the GAD-inducing DLX family, suggesting that non-GAD expressing neurons may be lost in AD. EC = entorhinal cortex, HIP = hippocampus, MTG = middle temporal gyrus, PC = posterior cingulate cortex, SFG = superior frontal gyrus, VCX = visual cortex, NMN = neuron marker normalized, inhib = inhibited. All reaction and metabolite abbreviations are defined in Supplementary Tables 1– 2.
Figure 4
Figure 4. Metabolically affected brain regions in AD show significant suppression of central metabolic pathways
In certain AD brain regions, the metabolic rate of glucose decreases more than can be explained by brain atrophy. PathWave analysis demonstrates that histopathogically normal cells from the metabolically affected brain regions (EC, HIP, MTG, and PC) demonstrate a significant suppression of central metabolic pathways, such as (a) glycolysis and (b) the TCA cycle and surrounding reactions. Metabolically less affected regions (SFG and VCX) show no significant suppression. Reaction suppression shown here is a composite expression of the reaction associated genes and the genes of closely connected reactions. Only significantly changed reactions are shown (FDR = 0.05). EC = entorhinal cortex, HIP = hippocampus, MTG = middle temporal gyrus, PC = posterior cingulate cortex, SFG = superior frontal gyrus, VCX = visual cortex. All reaction and metabolite abbreviations are defined in Supplementary Tables 1– 2.
Figure 5
Figure 5. Singular Value Decomposition (SVD) of feasible pathways elucidates potential pathways that allow for coupling of mitochondria acetyl-CoA metabolism and cytosolic acetylcholine production
21,000 unique feasible reaction sets were computed, each showing transport of mitochondrial acetyl-CoA carbon to the cytosol in human metabolism. SVD of a matrix of all 21,000 pathways yielded 3 primary pathways that allow this coupling of mitochondrial metabolism to acetylcholine production, by carrying the acetyl-CoA carbon on (a) N-acetyl-L-apartate, (b) citrate, or (c) acetoacetate. As shown by the second singular vector, reactions in the pathway with citrate tend to be missing from pathways when the reactions for the acetoacetate pathway are included. The third singular vector shows a similar relationship of the N-acetyl-L-aspartate pathway. The omic data and known enzyme localization only support the usage of citrate and acetoacetate as potential carriers in neurons.
Figure 6
Figure 6. Model-aided prediction of cholinergic contribution is consistent with experimental acetylcholine production
Percent brain cholinergic neurotransmission was predicted based on 14 sets of experimental data in which brain minces were fed [1-14C]-pyruvate or [2-14C]-pyruvate, followed by measurement of 14C-labeled CO2 and acetylcholine. (a) For each experiment, the feasible amount of the brain that can generate the experimental response was computed, centering at 3.3%. (b) This parameter was employed in the analysis, and the updated model predictions were consistent with experimental data, such as seen in the case of treating the brain minces with [1-14C]-pyruvate and increasing levels of the pyruvate-dehydrogenase inhibitor bromopyruvate. Moreover, the updated model predictions were consistent with measured 14C-labeled CO2 and acetylcholine production for brain minces that were treated with three PDHm inhibitors withheld from previous computations for both supplementation with (c) [1-14C]-pyruvate and (d) [2-14C]-pyruvate. Error bars on the simulation results represent 25th and 75th percentiles. ChAT = choline acetyltransferase.

References

    1. Feist AM, Palsson BO. The growing scope of applications of genome-scale metabolic reconstructions using Escherichia coli. Nat. Biotechnol. 2008;26:659–667. - PMC - PubMed
    1. Oberhardt MA, Palsson BO, Papin JA. Applications of genome-scale metabolic reconstructions. Mol. Syst. Biol. 2009;5:320. - PMC - PubMed
    1. Breitling R, Vitkup D, Barrett MP. New surveyor tools for charting microbial metabolic maps. Nat. Rev. Microbiol. 2008;6:156–161. - PubMed
    1. Thiele I, Palsson BO. A protocol for generating a high-quality genome-scale metabolic reconstruction. Nat. Protocols. 2010;5:93–121. - PMC - PubMed
    1. Lewis NE, Jamshidi N, Thiele I, Palsson BØ. Encyclopedia of Complexity and Systems Science. Vol. 5535. New York: Springer; 2009.

Publication types