. 2011 Jan;7(1):34-40.
doi: 10.1038/nchembio.478. Epub 2010 Nov 21.

Signaling diversity of PKA achieved via a Ca2+-cAMP-PKA oscillatory circuit

Affiliations

Signaling diversity of PKA achieved via a Ca2+-cAMP-PKA oscillatory circuit

Qiang Ni et al. Nat Chem Biol. 2011 Jan.

Abstract

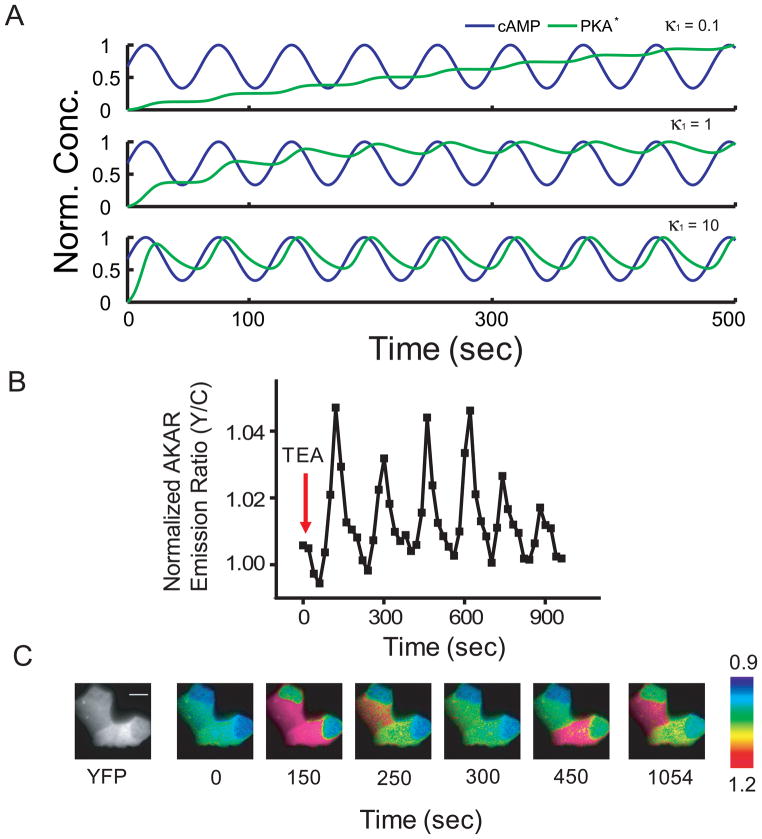
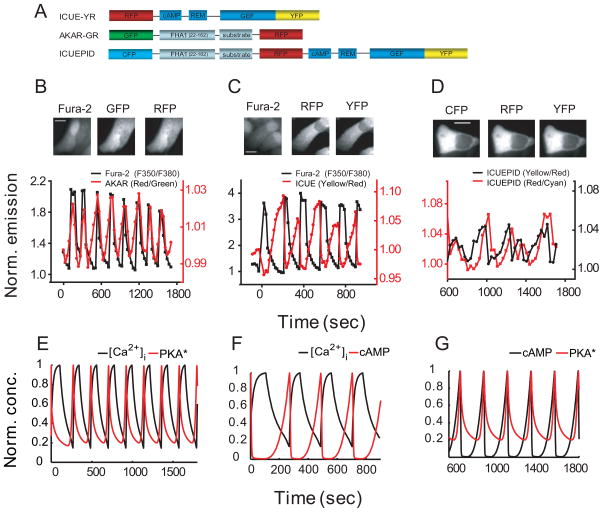
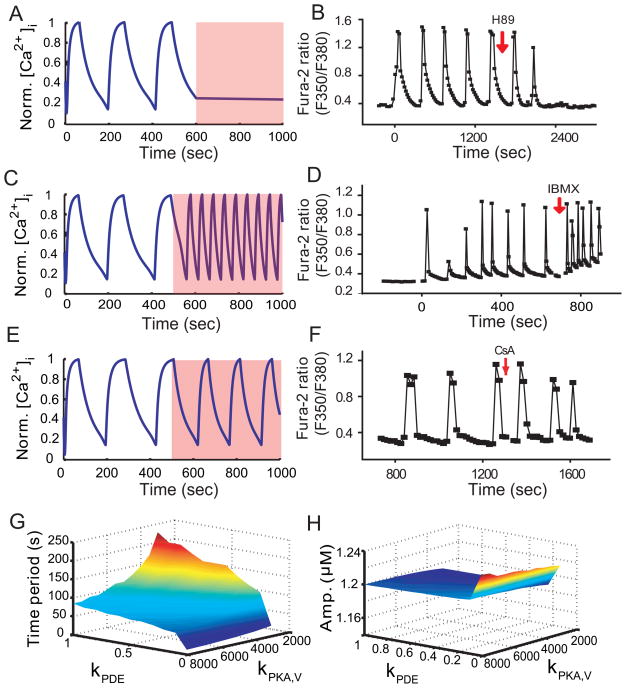
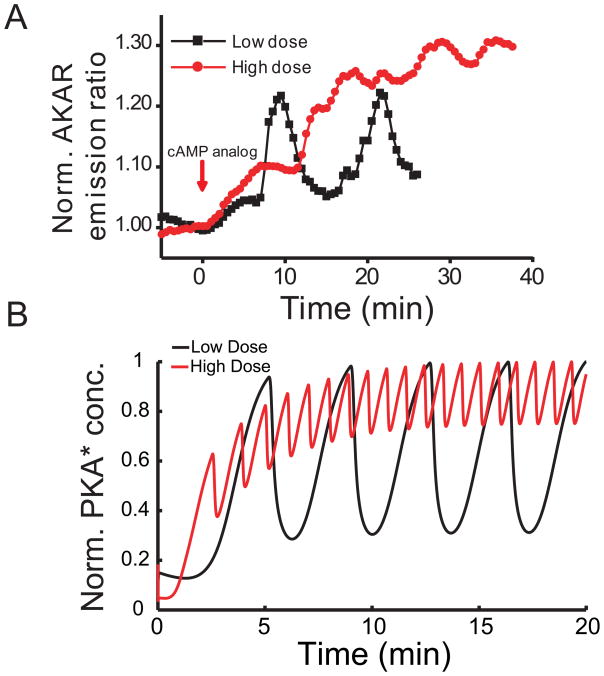
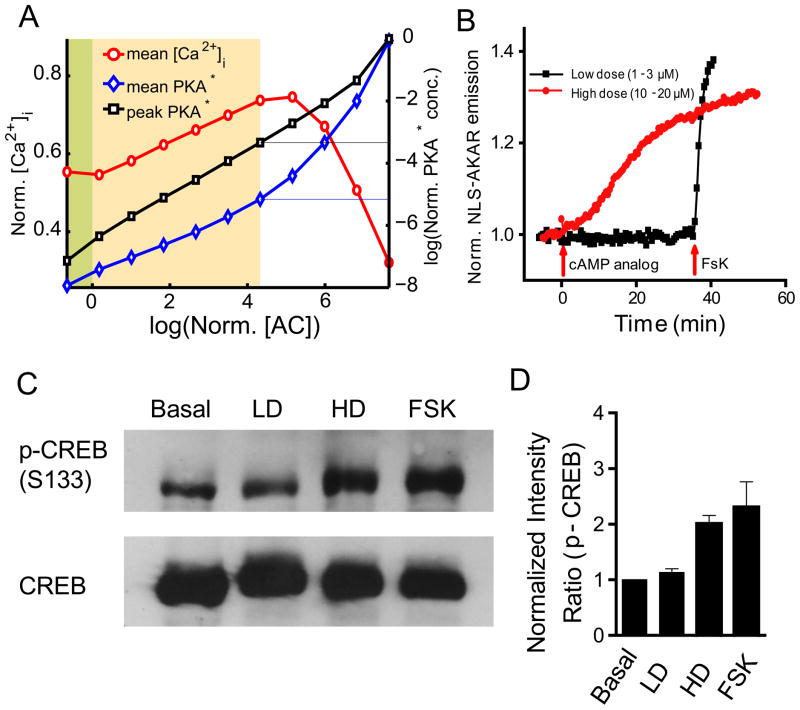
Many protein kinases are key nodal signaling molecules that regulate a wide range of cellular functions. These functions may require complex spatiotemporal regulation of kinase activities. Here, we show that protein kinase A (PKA), Ca(2+) and cyclic AMP (cAMP) oscillate in sync in insulin-secreting MIN6 beta cells, forming a highly integrated oscillatory circuit. We found that PKA activity was essential for this oscillatory circuit and was capable of not only initiating the signaling oscillations but also modulating their frequency, thereby diversifying the spatiotemporal control of downstream signaling. Our findings suggest that exquisite temporal control of kinase activity, mediated via signaling circuits resulting from cross-regulation of signaling pathways, can encode diverse inputs into temporal parameters such as oscillation frequency, which in turn contribute to proper regulation of complex cellular functions in a context-dependent manner.


Conflict of interest statement

Competing Financial Interests

The authors declare no competing financial interests.

Figures

Figure 1
Figure 1
Oscillatory changes in PKA activity in single MIN6 β cells. (A) Simulation of PKA activity in the presence of oscillatory cAMP, showing different activity patterns depending on the characteristics of the oscillations and parameters of PKA activation and deactivation. The parameter, K1, reflecting the binding of cAMP to PKA homodimer was varied in this simulation. The parameter κ1 is the ratio of the new value to the nominal value of K1. (B) A representative time course of yellow-over-cyan emission ratio changes in single MIN6 β cells expressing AKAR, a FRET-based PKA activity reporter, revealed single-cell PKA activity oscillations (n = 21). (C) Pseudocolor images of MIN6 β cells expressing AKAR show oscillatory PKA activity after TEA treatment. The distribution of AKAR is shown by the YFP fluorescence image. Scale bar = 10 μm.
Figure 2
Figure 2
Oscillatory changes in PKA activity, cAMP and Ca2+ dynamics are highly coordinated in MIN6 cells. (A) Domain structures of ICUE-YR, AKAR-GR, and a single-chain dual-specificity biosensor, ICUEPID, for PKA activity and cAMP dynamics. (B) (Top panel) Fluorescence images of MIN6 cells expressing AKAR-GR loaded with Fura-2. (Bottom Panel) Representative time courses showing coordinated oscillations in PKA activity (monitored by AKAR-GR, red) and Ca2+ (monitored by Fura-2, black) in single MIN6 cells. Scale bar = 10 μm. (C) (Top panel) Fluorescence images of a MIN6 cell expressing ICUE-YR loaded with Fura-2. (Bottom Panel) Representative time courses showing coordinated oscillations in cAMP (monitored by ICUE-YR, red) and Ca2+ (monitored by Fura-2, black) in single MIN6 cells. Scale bar = 10 μm. (D) (Top panel) Fluorescence images of a MIN6 cell expressing ICUEPID (bottom Panel). Representative time courses showing coordinated oscillations in PKA activity (red) and cAMP (black) monitored by ICUEPID in single MIN6 cells. Scale bar = 10 μm. (E) Simulation of the model showing Ca2+ (black) and active PKA (PKA*, red) oscillations. (F) Simulation of the mathematical model showing Ca2+ (black) and cAMP (red) oscillations. (G) Simulation of the model showing cAMP (black) and active PKA (PKA*, red) oscillations. Norm. emission and Norm. conc. refer to normalized emission and normalized concentration respectively, with normalization in simulations made with respect to the maximal value in the corresponding time course.
Figure 3
Figure 3
PKA activity is required for Ca2+ oscillation and tunes its frequency. (A) Simulation of the model in the presence or absence of PKA (shaded region). (B) The effect of inhibiting PKA by H89 (10 μM) on Ca2+ oscillation. (C) Simulation of the model with increased feedback achieved when PDE activity is decreased (shaded region). (D) Effect of adding a PDE inhibitor IBMX (100 μM) on Ca2+ oscillations (n = 15). (E) Simulation of the model with increased feedback achieved when PP2B activity is decreased (shaded region). (F) Effect of adding a PP2B inhibitor cyclosporine A (CsA) (3 μM) on Ca2+ oscillations (n = 7). (G) Effect of PKA activation and activity parameters on the frequency of oscillations, simulated by the simultaneous variation of a parameter relating to the extent of PKA phosphorylation of channels (kPKA,V) and a parameter controlling the maximal activity of PDE (kPDE). (H) Effect of PKA activation and activity parameters on the amplitude of oscillations, simulated by the simultaneous variation of kPKA,V and kPDE. Note the scale of the amplitude changes. Norm. [Ca2+]i refers to intracellular Ca2+ concentration normalized to the maximal level and Amp. refers to amplitude of oscillations. See related analysis in the Supplementary Methods.
Figure 4
Figure 4
Direct activation of PKA triggers the oscillation of the circuit. (A) Representative time courses showing oscillatory and sustained PKA behaviors upon stimulation with low (1–3 μM) and high (10–20 μM) doses of a PKA-specific cAMP analog, respectively (n = 16 and 13, respectively). (B) Simulation of the model showing the oscillatory and sustained PKA activities upon stimulation with low and high levels of cAMP analog, reflecting the time needed for the analog accumulation in the simulated cells.
Figure 5
Figure 5
Oscillatory PKA activity confers spatial control of substrates. (A) Simulation of the model showing the indirect activities of local (normalized mean [Ca2+]) and global (using normalized mean PKA C-subunit concentration as a proxy) targets of PKA activation upon increase in the input AC activity and hence frequency of oscillations. The expected “local-activation” regime, defined by the AC activity at which the difference between log (Normalized mean PKAactivity) and log (Normalized peak PKAactivity) is maximal, is shaded in orange. The area shaded in green is bounded by the nominal AC activity, reflecting the expected physiological scenario. (B) Representative time courses of nuclear localized AKAR (NLS-AKAR) showing the absence and presence of nuclear PKA activity upon stimulation with low (1–3 μM) and high (10–20 μM) doses of a PKA-specific cAMP analog, respectively (n = 7 and 4, respectively). (C) Phospho-immunoblot analysis using antiphospho-CREB (pS133) shows no changes in CREB phosphorylation upon stimulation with a low dose (LD) of the cAMP analog (2 μM), while increased phosphorylation of CREB is observed upon stimulation with a high dose (HD) of the same cAMP analog (10 μM) or 50 μM forskolin (FSK). (D) Densitometric analysis of phosphorylated CREB (pS133) (n =3) normalized to CREB expression shows a significant difference between the levels of CREB phosphorylation stimulated by the low and high doses of the cAMP analog.

Similar articles

Cited by

References

    1. Manning G, Whyte DB, Martinez R, Hunter T, Sudarsanam S. The protein kinase complement of the human genome. Science. 2002;298:1912–1934. - PubMed
    1. Ubersax JA, Ferrell JE., Jr Mechanisms of specificity in protein phosphorylation. Nat Rev Mol Cell Biol. 2007;8:530–541. - PubMed
    1. Carnegie GK, Means CK, Scott JD. A-kinase anchoring proteins: from protein complexes to physiology and disease. IUBMB Life. 2009;61:394–406. - PMC - PubMed
    1. Brown MD, Sacks DB. Protein scaffolds in MAP kinase signalling. Cell Signal. 2009;21:462–469. - PMC - PubMed
    1. Marshall CJ. Specificity of receptor tyrosine kinase signaling: transient versus sustained extracellular signal-regulated kinase activation. Cell. 1995;80:179–185. - PubMed

Publication types