. 2010 Dec;31(12):1576-82.
doi: 10.1038/aps.2010.161. Epub 2010 Nov 22.

Chronic ethanol consumption up-regulates protein-tyrosine phosphatase-1B (PTP1B) expression in rat skeletal muscle

Affiliations

Chronic ethanol consumption up-regulates protein-tyrosine phosphatase-1B (PTP1B) expression in rat skeletal muscle

Li GAO et al. Acta Pharmacol Sin. 2010 Dec.

Abstract

Aim: to investigate the potential effects of chronic ethanol intake on protein-tyrosine phosphatase-1B (PTP1B) and the insulin receptor signaling pathway in rat skeletal muscle.

Methods: rats received ethanol treatment at a daily dose of 0 (control), 0.5 (group L), 2.5 (group M) or 5 gxkg(-1) (group H) via gastric gavage for 22 weeks. In vivo insulin sensitivity was measured using a hyperinsulinemic-euglycemic clamp. Expression of PTP1B in skeletal muscles was examined at both the mRNA (real-time PCR) and protein (Western blot) levels. PTP1B activity was assayed with a p-nitrophenol phosphate (PNPP) hydrolysis method. Changes of insulin signaling in skeletal muscle were analyzed with Western blotting.

Results: the activity and expression of PTP1B were dose-dependently elevated 1.6 and 2.0 fold in the skeletal muscle by ethanol, resepctively, at the doses of 2.5 and 5 gxkg(-1)xd(-1). Total IRβ and IRS-1, as well as their phosphorylated forms, were decreased by ethanol at the two higher doses. Moreover, chronic ethanol consumption resulted in a significant inhibition of the association between IRS-1 and the p85 subunit of phosphatidylinositol 3-kinase, inhibition of Akt phosphorylation and reduced levels of mitogen-activated protein kinase phosphorylation.

Conclusion: chronic ethanol intake at 2.5 and 5 xkg(-1)xd(-1) sufficient doses can down-regulate the expression of IRβ, P-IRβ, and IRS-1, as well as the phosphorylated forms of IRS-1 and Akt, in rat skeletal muscle, possibly through increased PTP1B activity.


Figures
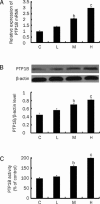
Figure 1
Figure 1
Effects of ethanol on PTP1B in rat skeletal muscle. (A) PTP1B mRNA levels were determined using RT-PCR. (B) PTP1B protein levels were determined by Western blot analysis. (C) PTP1B activities were assayed using PTP1B assay kit. Compared to the control group, the PTP1B levels in groups M and H increased significantly (bP<0.05, cP<0.01 vs group C). n=15. Values are given as means±SD. C, control; H, 5 g·kg−1·d−1 ethanol treatment; M, 2.5 g·kg−1·d−1 ethanol treatment; and L, 0.5 g·kg−1·d−1 ethanol treatment.
Figure 2
Figure 2
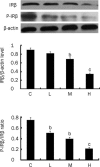
Expression of IRβ and P-IRβ protein levels in rat skeletal muscle. Levels of IRβ and P-IRβ protein were determined by Western blot analysis. Compared to the control group, the IRβ and P-IRβ proteins decreased significantly in groups M and H, while P-IRβ proteins decreased significantly in all ethanol-treated groups (bP<0.05, cP<0.01 vs group C). n=15. Values are given as means±SD.
Figure 3
Figure 3
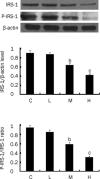
Expression of IRS-1and P-IRS-1 protein levels in rat skeletal muscle. Protein levels for IRS-1 and P-IRS-1 were determined by Western blot analysis. Compared to the control group, levels in groups M and H decreased significantly (bP<0.05, cP<0.01 vs group C). n=15. Values are given as means±SD.
Figure 4
Figure 4
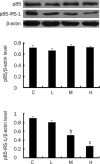
Expression of PI3K protein levels in rat skeletal muscle. Levels of p85 subunit of PI3K and p85-associated IRS-1 protein were determined by Western blot analysis. Compared to the control group, the p85-associated IRS-1 proteins in groups M and H decreased significantly (bP<0.05, cP<0.01 vs group C). In contrast, p85 protein levels were similar in control and ethanol-treated groups. n=15. Values are given as means±SD.
Figure 5
Figure 5
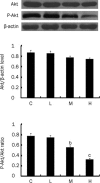
Expression of Akt and P-Akt protein levels in rat skeletal muscle determined by Western blot analysis. Compared to the control group, the P-Akt proteins in groups M and H decreased significantly (bP<0.05, cP<0.01 vs group C). There were no differences in Akt protein levels among the groups. n=15. Values are given as means±SD.
Figure 6
Figure 6
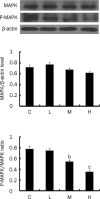
Expression of MAPK and P-MAPK protein levels in rat skeletal muscle were determined by Western blot analysis. Compared to the control group, the P-MAPK proteins in groups M and H decreased significantly (bP<0.05, cP<0.01 vs group C). There were no differences in MAPK protein levels among the groups. n=15. Values are given as means±SD.

Similar articles

Cited by

References

    1. Fowman DT. The effect of ethanol and its metabolites on carbohydrate, protein and lipid metabolism. Ann Clin Lab Sci. 1988;18:181–9. - PubMed
    1. Rimm EB, Chan J, Stampfer MJ, Colditz GA, Willett WC. Prospective study of cigarette smoking, alcohol use, and the risk of diabetes in men. BMJ. 1995;310:555–9. - PMC - PubMed
    1. Dornhorst A, Ouyang A. Effect of alcohol on glucose tolerance. Lancet. 1971;2(7731):957–9. - PubMed
    1. Shelmet JJ, Reichard GA, Skutches CL, Hoeldtke RD, Owen OE, Boden G, et al. Ethanol causes acute inhibition of carbohydrate, fat, and protein oxidation and insulin resistance. J Clin Invest. 1988;81:1137–45. - PMC - PubMed
    1. Cttensmeyer FP, Beniac DR, Luo RZ. Mechanism of transmembrane signaling: insulin binding and the insulin receptor. Biochemistry. 2000;39:12103–12. - PubMed

Publication types

MeSH terms