

Osteopontin is required for the early onset of high fat diet-induced insulin resistance in mice
- PMID: 21103061
- PMCID: PMC2980483
- DOI: 10.1371/journal.pone.0013959
Osteopontin is required for the early onset of high fat diet-induced insulin resistance in mice
Abstract
Background: Insulin resistance is manifested in muscle, adipose tissue, and liver and is associated with adipose tissue inflammation. The cellular components and mechanisms that regulate the onset of diet-induced insulin resistance are not clearly defined.
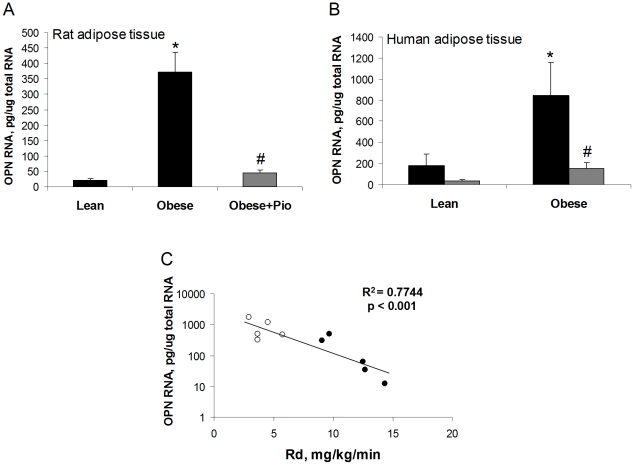
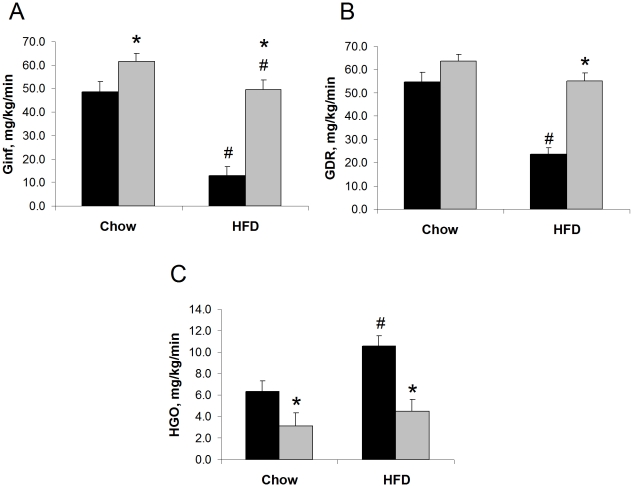
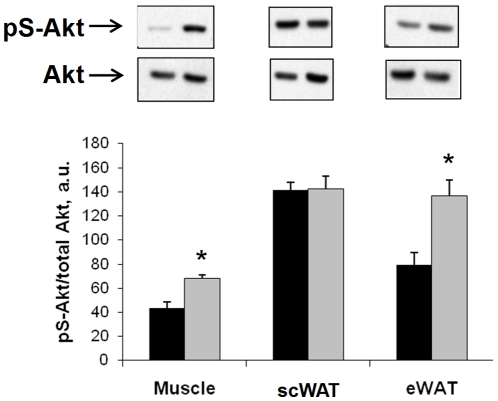
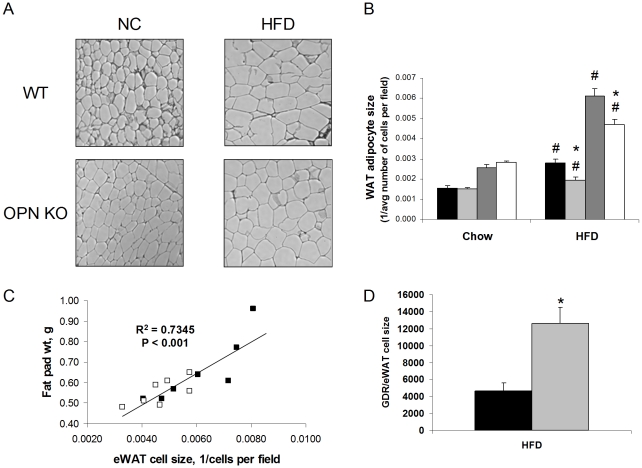
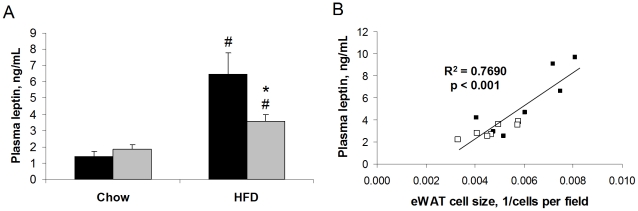
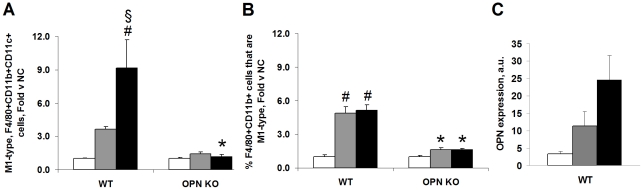
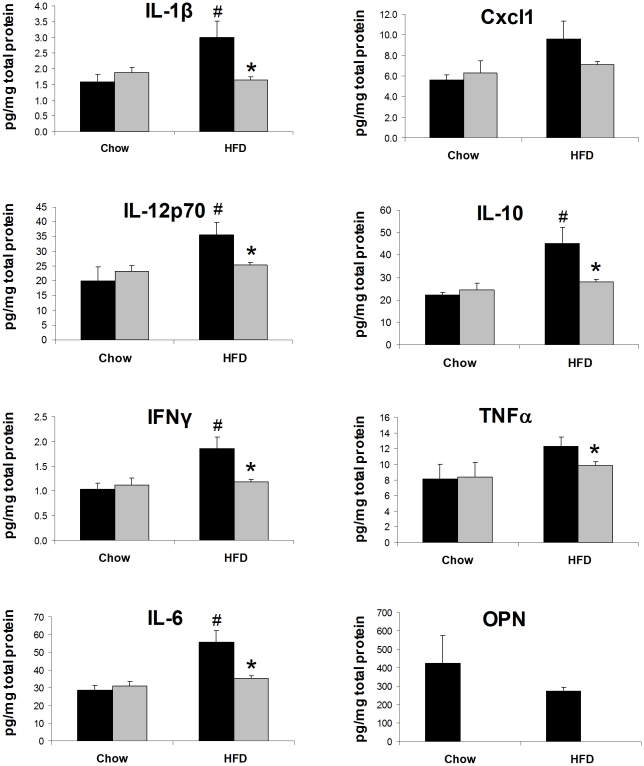
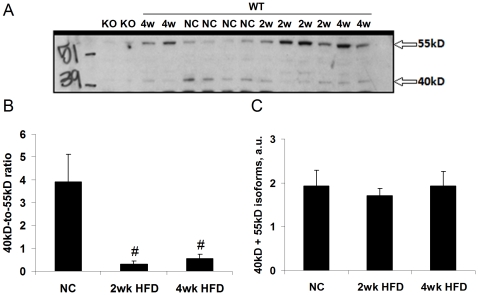
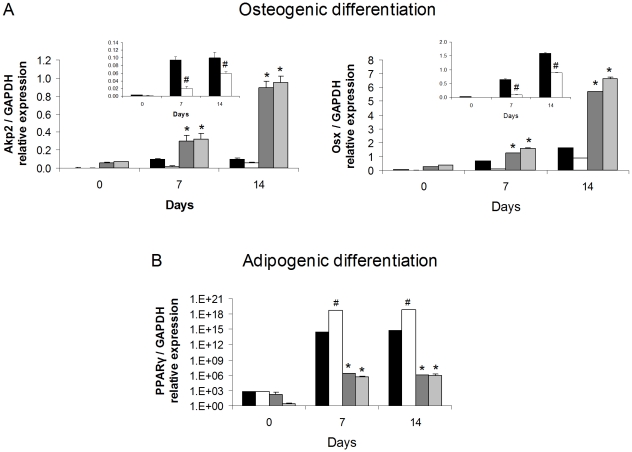
Methodology and principal findings: We initially observed osteopontin (OPN) mRNA over-expression in adipose tissue of obese, insulin resistant humans and rats which was normalized by thiazolidinedione (TZD) treatment in both species. OPN regulates inflammation and is implicated in pathogenic maladies resulting from chronic obesity. Thus, we tested the hypothesis that OPN is involved in the early development of insulin resistance using a 2-4 week high fat diet (HFD) model. OPN KO mice fed HFD for 2 weeks were completely protected from the severe skeletal muscle, liver and adipose tissue insulin resistance that developed in wild type (WT) controls, as determined by hyperinsulinemic euglycemic clamp and acute insulin-stimulation studies. Although two-week HFD did not alter body weight or plasma free fatty acids and cytokines in either strain, HFD-induced hyperleptinemia, increased adipose tissue inflammation (macrophages and cytokines), and adipocyte hypertrophy were significant in WT mice and blunted or absent in OPN KO mice. Adipose tissue OPN protein isoform expression was significantly altered in 2- and 4-week HFD-fed WT mice but total OPN protein was unchanged. OPN KO bone marrow stromal cells were more osteogenic and less adipogenic than WT cells in vitro. Interestingly, the two differentiation pathways were inversely affected by HFD in WT cells in vitro.
Conclusions: The OPN KO phenotypes we report reflect protection from insulin resistance that is associated with changes in adipocyte biology and adipose tissue inflammatory status. OPN is a key component in the development of HFD-induced insulin resistance.
Conflict of interest statement
Figures
Similar articles
-
12/15-lipoxygenase is required for the early onset of high fat diet-induced adipose tissue inflammation and insulin resistance in mice.PLoS One. 2009 Sep 29;4(9):e7250. doi: 10.1371/journal.pone.0007250. PLoS One. 2009. PMID: 19787041 Free PMC article.
-
Osteopontin deletion prevents the development of obesity and hepatic steatosis via impaired adipose tissue matrix remodeling and reduced inflammation and fibrosis in adipose tissue and liver in mice.PLoS One. 2014 May 28;9(5):e98398. doi: 10.1371/journal.pone.0098398. eCollection 2014. PLoS One. 2014. PMID: 24871103 Free PMC article.
-
Targeted deletion of growth hormone (GH) receptor in macrophage reveals novel osteopontin-mediated effects of GH on glucose homeostasis and insulin sensitivity in diet-induced obesity.J Biol Chem. 2013 May 31;288(22):15725-35. doi: 10.1074/jbc.M113.460212. Epub 2013 Apr 17. J Biol Chem. 2013. PMID: 23595986 Free PMC article.
-
Differential effects of high-fat-diet rich in lard oil or soybean oil on osteopontin expression and inflammation of adipose tissue in diet-induced obese rats.Eur J Nutr. 2013 Apr;52(3):1181-9. doi: 10.1007/s00394-012-0428-z. Epub 2012 Jul 31. Eur J Nutr. 2013. PMID: 22847642
-
Elevated expression of osteopontin may be related to adipose tissue macrophage accumulation and liver steatosis in morbid obesity.Diabetes. 2009 Jan;58(1):125-33. doi: 10.2337/db08-0400. Epub 2008 Oct 24. Diabetes. 2009. PMID: 18952835 Free PMC article.
Cited by
-
The Novel-miR-659/SPP1 Interaction Regulates Fat Deposition in Castrated Male Pigs.Animals (Basel). 2022 Apr 7;12(8):944. doi: 10.3390/ani12080944. Animals (Basel). 2022. PMID: 35454191 Free PMC article.
-
Thromboinflammatory Processes at the Nexus of Metabolic Dysfunction and Prostate Cancer: The Emerging Role of Periprostatic Adipose Tissue.Cancers (Basel). 2022 Mar 25;14(7):1679. doi: 10.3390/cancers14071679. Cancers (Basel). 2022. PMID: 35406450 Free PMC article. Review.
-
Markers Are Shared Between Adipogenic and Osteogenic Differentiated Mesenchymal Stem Cells.J Dev Biol Tissue Eng. 2013 May 1;5(2):18-25. doi: 10.5897/JDBTE2013.0065. J Dev Biol Tissue Eng. 2013. PMID: 24013643 Free PMC article.
-
Peptide- and Amine-Modified Glucan Particles for the Delivery of Therapeutic siRNA.Mol Pharm. 2016 Mar 7;13(3):964-978. doi: 10.1021/acs.molpharmaceut.5b00831. Epub 2016 Feb 11. Mol Pharm. 2016. PMID: 26815386 Free PMC article.
-
Osteopontin Deficiency Alters Biliary Homeostasis and Protects against Gallstone Formation.Sci Rep. 2016 Aug 3;6:30215. doi: 10.1038/srep30215. Sci Rep. 2016. PMID: 27484115 Free PMC article.
References
-
- Matsuzawa Y. The metabolic syndrome and adipocytokines. FEBS Lett. 2006;580:2917–2921. - PubMed
-
- Hotamisligil GS. Inflammation and metabolic disorders. Nature. 2006;444:860–867. - PubMed
-
- Berger JP, Akiyama TE, Meinke PT. PPARs: therapeutic targets for metabolic disease. Trends in Pharmacological Sciences. 2005;26:244–251. - PubMed
Publication types
MeSH terms
Substances
Grants and funding
LinkOut - more resources
Full Text Sources
Other Literature Sources
Medical
Molecular Biology Databases
Research Materials
