. 2010 Nov 17;5(11):e14030.
doi: 10.1371/journal.pone.0014030.

Improvement of aroma in transgenic potato as a consequence of impairing tuber browning

Affiliations

Improvement of aroma in transgenic potato as a consequence of impairing tuber browning

Briardo Llorente et al. PLoS One. .

Abstract

Sensory analysis studies are critical in the development of quality enhanced crops, and may be an important component in the public acceptance of genetically modified foods. It has recently been established that odor preferences are shared between humans and mice, suggesting that odor exploration behavior in mice may be used to predict the effect of odors in humans. We have previously found that mice fed diets supplemented with engineered nonbrowning potatoes (-PPO) consumed more potato than mice fed diets supplemented with wild-type potatoes (WT). This prompted us to explore a possible role of potato odor in mice preference for nonbrowning potatoes. Taking advantage of two well established neuroscience paradigms, the "open field test" and the "nose-poking preference test", we performed experiments where mice exploration behavior was monitored in preference assays on the basis of olfaction alone. No obvious preference was observed towards -PPO or WT lines when fresh potato samples were tested. However, when oxidized samples were tested, mice consistently investigated -PPO potatoes more times and for longer periods than WT potatoes. Congruently, humans discriminated WT from -PPO samples with a considerably better performance when oxidized samples were tested than when fresh samples were tested in blind olfactory experiments. Notably, even though participants ranked all samples with an intermediate level of pleasantness, there was a general consensus that the -PPO samples had a more intense odor and also evoked the sense-impression of a familiar vegetable more often than the WT samples. Taken together, these findings suggest that our previous observations might be influenced, at least in part, by differential odors that are accentuated among the lines once oxidative deterioration takes place. Additionally, our results suggest that nonbrowning potatoes, in addition to their extended shelf life, maintain their odor quality for longer periods of time than WT potatoes. To our knowledge this is the first report on the use of an animal model applied to the sensory analysis of a transgenic crop.


Conflict of interest statement

Competing Interests: The authors have declared that no competing interests exist.

Figures

Figure 1
Figure 1. Mouse open field experimental design.
(A) Schematic upper view of the open field activity boxes with zones A and B comprising food containers. (B) Diagram showing the open field experimental procedure. From day 1 to day 3 mice were habituated to the activity boxes with empty food containers. On day 4, mice exploration behavior was monitored with empty food containers and the data obtained was considered as a negative experimental control (−). On day 5, freshly cut potato samples (0 h) were randomly placed in containers A or B. On day 6, oxidized potato samples (24 h) were placed in the opposite positions with respect to day 5. On day 7, freshly cut WT potato samples were placed in one container while the other container remained empty and the data obtained was considered as a positive experimental control (+).
Figure 2
Figure 2. Mouse open field test experimental validation.
Percentage of entries (A) and exploration time spent (B) by mice in zones A and B of the open field with both food containers empty. (C) Representative 5 min mouse trajectory of a negative experimental control where both food containers were empty. Percentage of entries (D) and exploration time spent (E) by mice in zones A and B of the open field with one container filled with freshly cut WT potato and the other one left empty. (F) Representative 5 min mouse trajectory of a positive experimental control where food container A was empty and food container B was filled with freshly cut WT potato samples. Central darker squares in Figures C and F represent zones A (on the left) and B (on the right). Stars represent statistically significant differences (P≤0.01) according to the one-sample t-test for difference from 50%. Error bars represent the ±95% confidence interval of eight independent experiments.
Figure 3
Figure 3. Odor exploration behavior in mice.
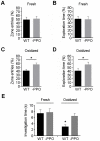
Percentage of entries (A) and exploration time spent (B) by mice in zones A and B of the open field with food containers filled with freshly cut (0 h) WT or -PPO potato samples. Percentage of entries (C) and exploration time spent (D) by mice in zones A and B of the open field with food containers filled with oxidized (24 h) WT or -PPO potato samples. Stars represent statistically significant differences (P≤0.03) according to the one-sample t-test for difference from 50%. Error bars represent the ±95% confidence interval of eight independent experiments. (E) Hole-board experiment. Mean investigation times (s) ± SEM of six independent measurements are shown for each type of sample. The star represents statistically significant differences (P≤0.05) in investigation time according to the ANOVA test followed by the Newman-Keuls multiple comparison post-hoc test.
Figure 4
Figure 4. Humans sensory analyses.
(A–B) Smell discrimination by humans. (A) Smell discrimination with all transgenic lines. A filled box indicates that the odor of the sample was described as more intense by the subject. (B) Triangle test with fresh and oxidized samples. The number of correct answers to be significant is 11 (P≤0.03) correct responses for the group tested with fresh samples (n = 19) and 25 (P≤0.001) correct responses for the group tested with oxidized samples (n = 42). The number of correct responses (+) was determined by counting the number of participants that chose the unique sample of the three. The number of incorrect responses (−) equals the number of participants not choosing the distinct sample of the three. The percentage of correct and incorrect responses is depicted and the number of the corresponding responses is shown inside each bar. Two stars represents statistically significant differences at P≤0.03 and three stars represents statistically significant differences at P≤0.001. (C–E) Organoleptic evaluations. (C) Hedonic rating. Being 1: “not at all pleasant” and being 9: “very pleasant”. No statistical differences were found among samples according to the ANOVA test. (D) Comments describing that the odor of the sample was more intense. The percentage of comments is depicted and the number of the corresponding comments is shown inside or above each bar. (E) Comments describing that the odor of the sample evoked the sense-impression of a familiar vegetable. The percentage of comments is depicted and the number of the corresponding comments is shown inside or above each bar.

Similar articles

Cited by

References

    1. Khan RM, Luk CH, Flinker A, Aggarwal A, Lapid H, et al. Predicting odor pleasantness from odorant structure: pleasantness as a reflection of the physical world. J Neurosci. 2007;27:10015–10023. - PMC - PubMed
    1. Mandairon N, Poncelet J, Bensafi M, Didier A. Humans and mice express similar olfactory preferences. PLoS One. 2009;4:e4209. - PMC - PubMed
    1. Small DM, Veldhuizen MG, Felsted J, Mak YE, McGlone F. Separable substrates for anticipatory and consummatory food chemosensation. Neuron. 2008;57:786–797. - PMC - PubMed
    1. Haddad R, Lapid H, Harel D, Sobel N. Measuring smells. Curr Opin Neurobiol. 2008;18:438–444. - PubMed
    1. Park S, Elles MP, Park J, Jenkins A, Lim W, et al. Sensory analysis of calcium-biofortified lettuce. Plant Biotechnol J. 2009;7:106–117. - PubMed

Publication types

MeSH terms

Substances