

Dynamic, large-scale profiling of transcription factor activity from live cells in 3D culture
- PMID: 21103341
- PMCID: PMC2984444
- DOI: 10.1371/journal.pone.0014026
Dynamic, large-scale profiling of transcription factor activity from live cells in 3D culture
Abstract
Background: Extracellular activation of signal transduction pathways and their downstream target transcription factors (TFs) are critical regulators of cellular processes and tissue development. The intracellular signaling network is complex, and techniques that quantify the activities of numerous pathways and connect their activities to the resulting phenotype would identify the signals and mechanisms regulating tissue development. The ability to investigate tissue development should capture the dynamic pathway activity and requires an environment that supports cellular organization into structures that mimic in vivo phenotypes. Taken together, our objective was to develop cellular arrays for dynamic, large-scale quantification of TF activity as cells organized into spherical structures within 3D culture.
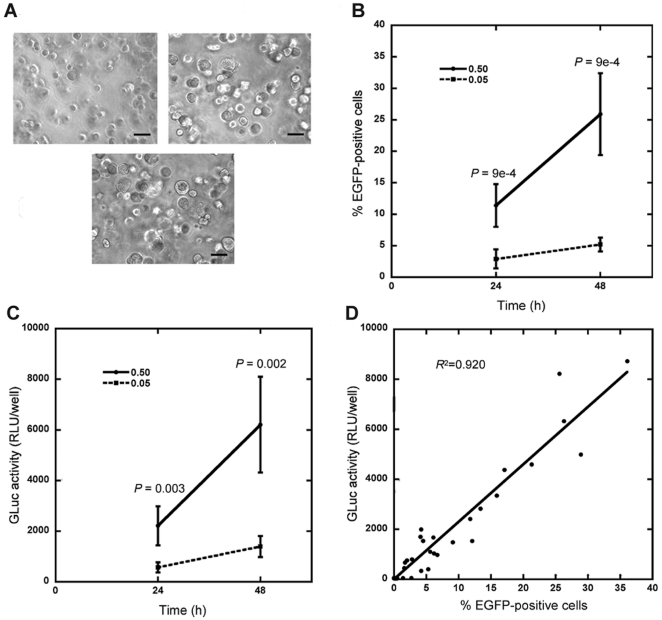
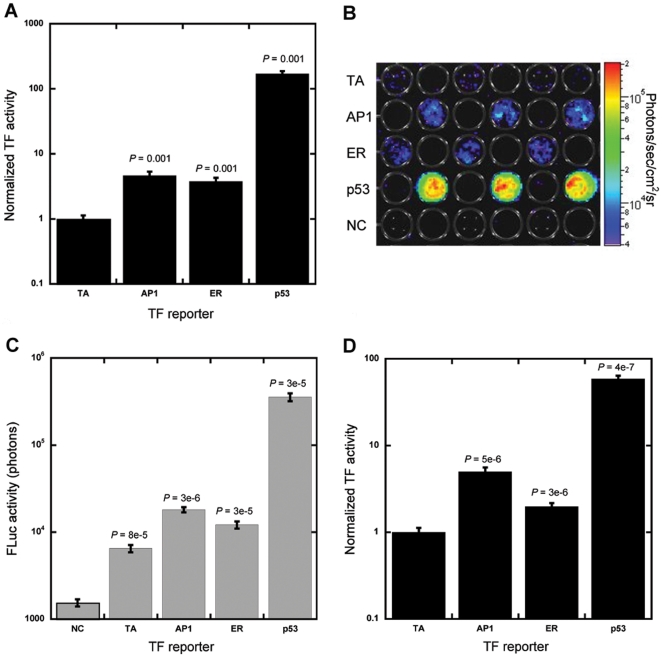
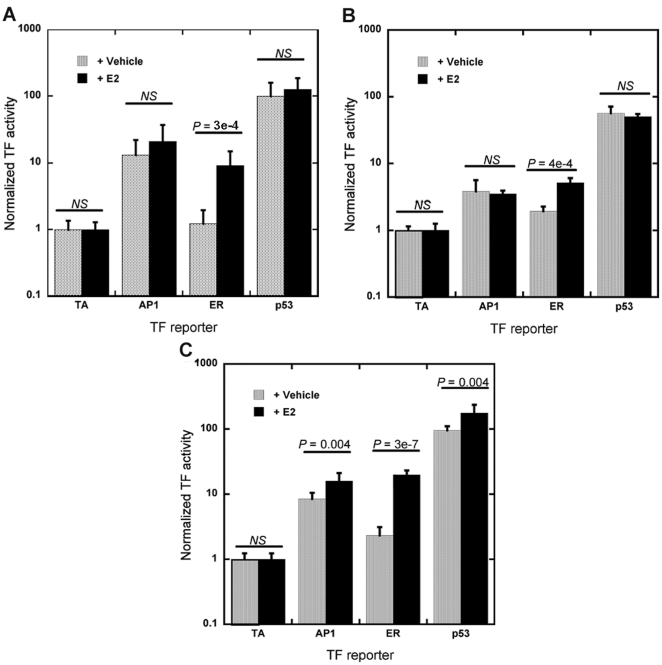
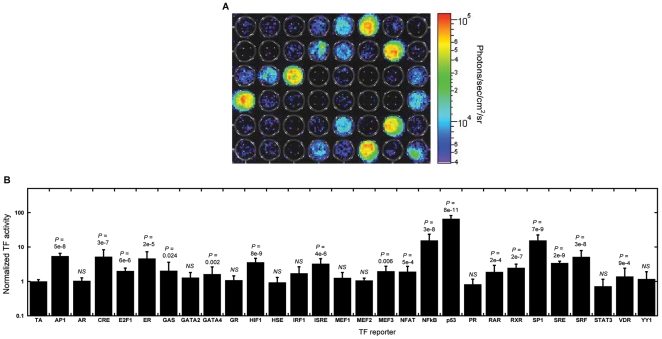
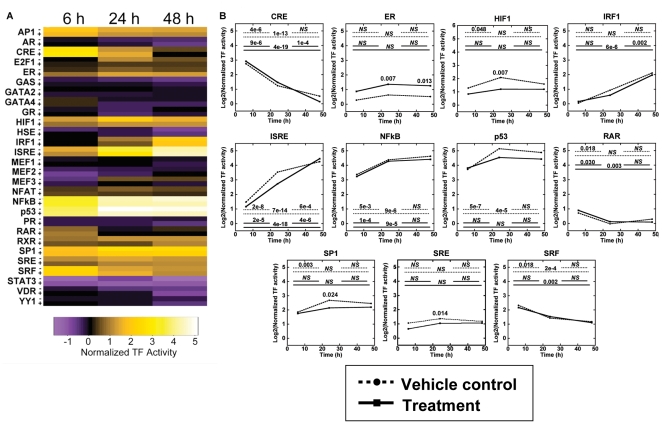
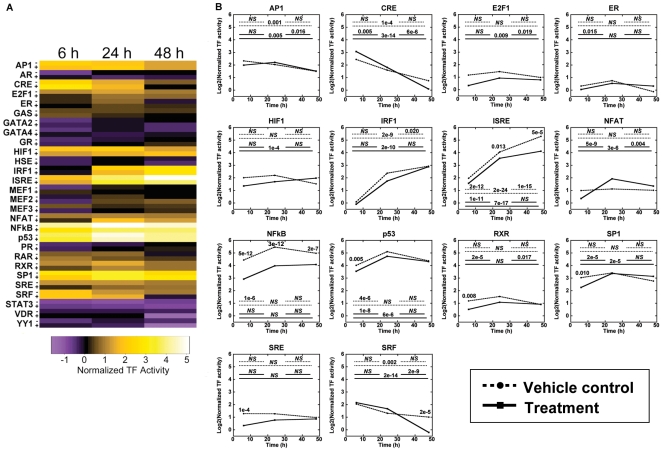
Methodology/principal findings: TF-specific and normalization reporter constructs were delivered in parallel to a cellular array containing a well-established breast cancer cell line cultured in Matrigel. Bioluminescence imaging provided a rapid, non-invasive, and sensitive method to quantify luciferase levels, and was applied repeatedly on each sample to monitor dynamic activity. Arrays measuring 28 TFs identified up to 19 active, with 13 factors changing significantly over time. Stimulation of cells with β-estradiol or activin A resulted in differential TF activity profiles evolving from initial stimulation of the ligand. Many TFs changed as expected based on previous reports, yet arrays were able to replicate these results in a single experiment. Additionally, arrays identified TFs that had not previously been linked with activin A.
Conclusions/significance: This system provides a method for large-scale, non-invasive, and dynamic quantification of signaling pathway activity as cells organize into structures. The arrays may find utility for investigating mechanisms regulating normal and abnormal tissue growth, biomaterial design, or as a platform for screening therapeutics.
Conflict of interest statement
Figures
Similar articles
-
Dynamic transcription factor activity profiling in 2D and 3D cell cultures.Biotechnol Bioeng. 2013 Feb;110(2):563-72. doi: 10.1002/bit.24718. Epub 2012 Sep 18. Biotechnol Bioeng. 2013. PMID: 22949103 Free PMC article.
-
Cellular arrays for large-scale analysis of transcription factor activity.Biotechnol Bioeng. 2011 Feb;108(2):395-403. doi: 10.1002/bit.22916. Biotechnol Bioeng. 2011. PMID: 20812256 Free PMC article.
-
Biased signaling of the angiotensin II type 1 receptor can be mediated through distinct mechanisms.PLoS One. 2010 Nov 30;5(11):e14135. doi: 10.1371/journal.pone.0014135. PLoS One. 2010. PMID: 21152433 Free PMC article.
-
Split luciferase complementation for analysis of intracellular signaling.Anal Sci. 2014;30(5):539-44. doi: 10.2116/analsci.30.539. Anal Sci. 2014. PMID: 24813951 Review.
-
Rational design of genetically encoded reporter genes for optical imaging of apoptosis.Apoptosis. 2020 Aug;25(7-8):459-473. doi: 10.1007/s10495-020-01621-5. Apoptosis. 2020. PMID: 32623548 Review.
Cited by
-
Nanoparticle dose and antigen loading attenuate antigen-specific T-cell responses.Biotechnol Bioeng. 2023 Jan;120(1):284-296. doi: 10.1002/bit.28252. Epub 2022 Oct 21. Biotechnol Bioeng. 2023. PMID: 36221192 Free PMC article.
-
Synergy of Paracrine Signaling During Early-Stage Mouse Ovarian Follicle Development In Vitro.Cell Mol Bioeng. 2018 Aug 9;11(5):435-450. doi: 10.1007/s12195-018-0545-8. eCollection 2018 Oct. Cell Mol Bioeng. 2018. PMID: 31719893 Free PMC article.
-
Transcription factor networks in invasion-promoting breast carcinoma-associated fibroblasts.Cancer Microenviron. 2013 Apr;6(1):91-107. doi: 10.1007/s12307-012-0121-z. Epub 2012 Oct 23. Cancer Microenviron. 2013. PMID: 23090154 Free PMC article.
-
Controlling multipotent stromal cell migration by integrating "course-graining" materials and "fine-tuning" small molecules via decision tree signal-response modeling.Biomaterials. 2011 Oct;32(30):7524-31. doi: 10.1016/j.biomaterials.2011.06.050. Epub 2011 Jul 22. Biomaterials. 2011. PMID: 21782235 Free PMC article.
-
The impact of adhesion peptides within hydrogels on the phenotype and signaling of normal and cancerous mammary epithelial cells.Biomaterials. 2012 May;33(13):3548-59. doi: 10.1016/j.biomaterials.2012.01.055. Epub 2012 Feb 15. Biomaterials. 2012. PMID: 22341213 Free PMC article.
References
-
- Courtois G, Gilmore TD. Mutations in the NF-kappaB signaling pathway: implications for human disease. Oncogene. 2006;25:6831–6843. - PubMed
-
- Miller-Jensen K, Janes KA, Brugge JS, Lauffenburger DA. Common effector processing mediates cell-specific responses to stimuli. Nature. 2007;448:604–608. - PubMed
-
- Dreesen O, Brivanlou AH. Signaling pathways in cancer and embryonic stem cells. Stem Cell Reviews. 2007;3:7–17. - PubMed
Publication types
MeSH terms
Substances
Grants and funding
LinkOut - more resources
Full Text Sources
Miscellaneous
