

Failure of fluid absorption in the endolymphatic sac initiates cochlear enlargement that leads to deafness in mice lacking pendrin expression
- PMID: 21103348
- PMCID: PMC2984494
- DOI: 10.1371/journal.pone.0014041
Failure of fluid absorption in the endolymphatic sac initiates cochlear enlargement that leads to deafness in mice lacking pendrin expression
Abstract
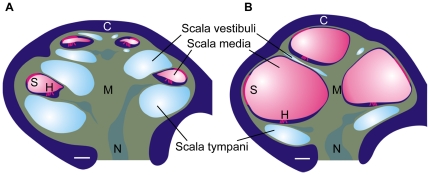
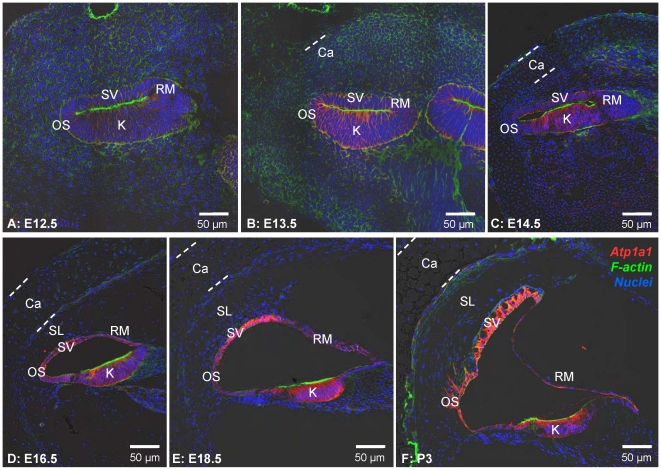
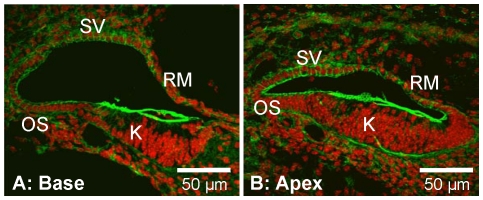
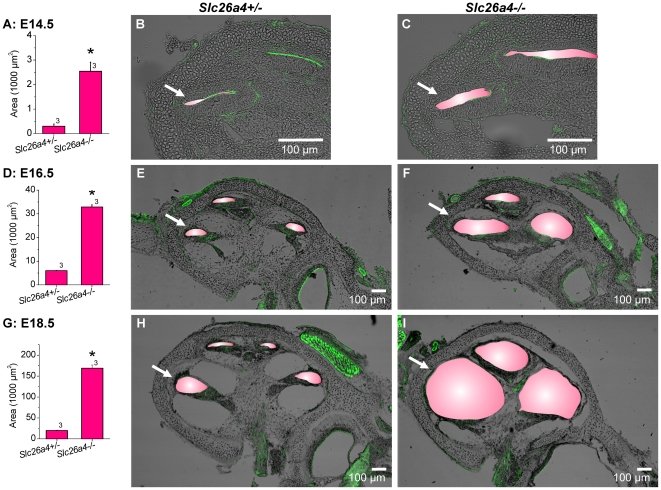
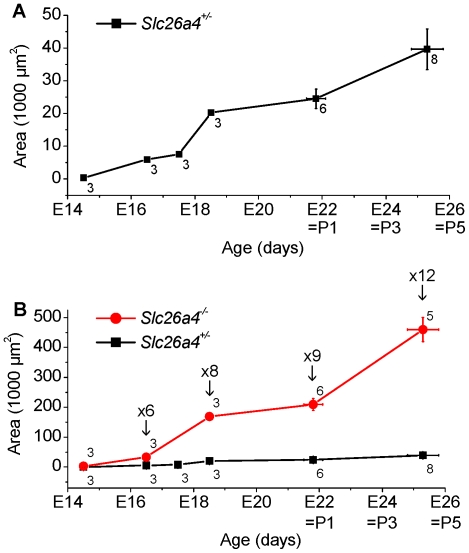
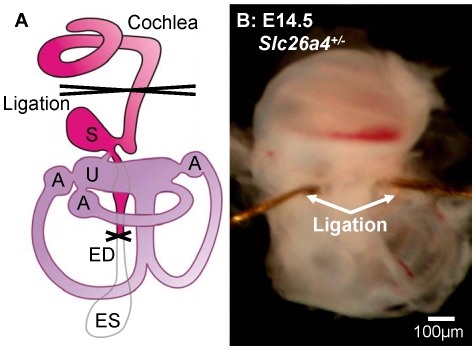
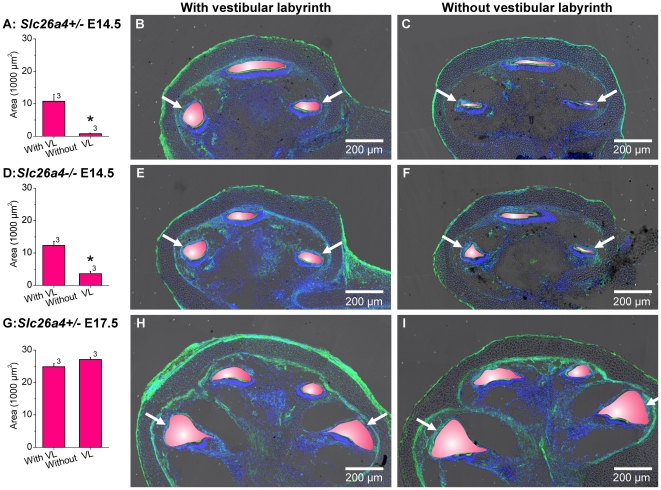
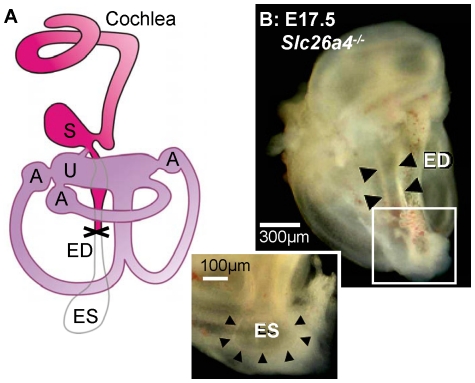
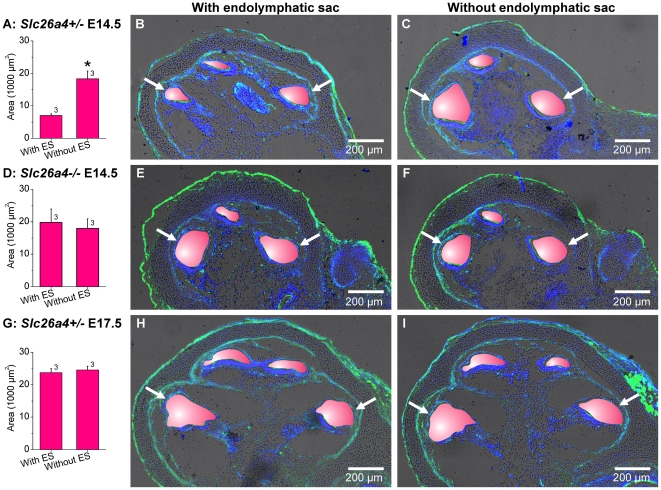
Mutations of SLC26A4 are among the most prevalent causes of hereditary deafness. Deafness in the corresponding mouse model, Slc26a4(-/-), results from an abnormally enlarged cochlear lumen. The goal of this study was to determine whether the cochlear enlargement originates with defective cochlear fluid transport or with a malfunction of fluid transport in the connected compartments, which are the vestibular labyrinth and the endolymphatic sac. Embryonic inner ears from Slc26a4(+/-) and Slc26a4(-/-) mice were examined by confocal microscopy ex vivo or after 2 days of organ culture. Culture allowed observations of intact, ligated or partially resected inner ears. Cochlear lumen formation was found to begin at the base of the cochlea between embryonic day (E) 13.5 and 14.5. Enlargement was immediately evident in Slc26a4(-/-) compared to Slc26a4(+/-) mice. In Slc26a4(+/-) and Slc26a4(-/-) mice, separation of the cochlea from the vestibular labyrinth by ligation at E14.5 resulted in a reduced cochlear lumen. Resection of the endolymphatic sacs at E14.5 led to an enlarged cochlear lumen in Slc26a4(+/-) mice but caused no further enlargement of the already enlarged cochlear lumen in Slc26a4(-/-) mice. Ligation or resection performed later, at E17.5, did not alter the cochlea lumen. In conclusion, the data suggest that cochlear lumen formation is initiated by fluid secretion in the vestibular labyrinth and temporarily controlled by fluid absorption in the endolymphatic sac. Failure of fluid absorption in the endolymphatic sac due to lack of Slc26a4 expression appears to initiate cochlear enlargement in mice, and possibly humans, lacking functional Slc26a4 expression.
Conflict of interest statement
Figures
Similar articles
-
Endolymphatic Na⁺ and K⁺ concentrations during cochlear growth and enlargement in mice lacking Slc26a4/pendrin.PLoS One. 2013 May 31;8(5):e65977. doi: 10.1371/journal.pone.0065977. Print 2013. PLoS One. 2013. PMID: 23741519 Free PMC article.
-
Epithelial cell stretching and luminal acidification lead to a retarded development of stria vascularis and deafness in mice lacking pendrin.PLoS One. 2011 Mar 14;6(3):e17949. doi: 10.1371/journal.pone.0017949. PLoS One. 2011. PMID: 21423764 Free PMC article.
-
SLC26A4 targeted to the endolymphatic sac rescues hearing and balance in Slc26a4 mutant mice.PLoS Genet. 2013;9(7):e1003641. doi: 10.1371/journal.pgen.1003641. Epub 2013 Jul 11. PLoS Genet. 2013. PMID: 23874234 Free PMC article.
-
Mouse models for pendrin-associated loss of cochlear and vestibular function.Cell Physiol Biochem. 2013;32(7):157-65. doi: 10.1159/000356635. Epub 2013 Dec 18. Cell Physiol Biochem. 2013. PMID: 24429822 Free PMC article. Review.
-
Hearing loss associated with enlargement of the vestibular aqueduct: mechanistic insights from clinical phenotypes, genotypes, and mouse models.Hear Res. 2011 Nov;281(1-2):11-7. doi: 10.1016/j.heares.2011.05.009. Epub 2011 Jun 6. Hear Res. 2011. PMID: 21669267 Free PMC article. Review.
Cited by
-
Non-syndromic enlarged vestibular aqueduct caused by novel compound mutations of the SLC26A4 gene: a case report and literature review.Front Genet. 2023 Sep 7;14:1240701. doi: 10.3389/fgene.2023.1240701. eCollection 2023. Front Genet. 2023. PMID: 37745850 Free PMC article.
-
Mutanlallemand (mtl) and Belly Spot and Deafness (bsd) are two new mutations of Lmx1a causing severe cochlear and vestibular defects.PLoS One. 2012;7(11):e51065. doi: 10.1371/journal.pone.0051065. Epub 2012 Nov 30. PLoS One. 2012. PMID: 23226461 Free PMC article.
-
Transcriptomic Analysis Reveals an Altered Hcy Metabolism in the Stria Vascularis of the Pendred Syndrome Mouse Model.Neural Plast. 2021 Apr 17;2021:5585394. doi: 10.1155/2021/5585394. eCollection 2021. Neural Plast. 2021. PMID: 33959158 Free PMC article.
-
Development and evolution of the vestibular apparatuses of the inner ear.J Anat. 2021 Oct;239(4):801-828. doi: 10.1111/joa.13459. Epub 2021 May 28. J Anat. 2021. PMID: 34047378 Free PMC article. Review.
-
Atrophic thyroid follicles and inner ear defects reminiscent of cochlear hypothyroidism in Slc26a4-related deafness.Mamm Genome. 2014 Aug;25(7-8):304-16. doi: 10.1007/s00335-014-9515-1. Epub 2014 Apr 24. Mamm Genome. 2014. PMID: 24760582 Free PMC article.
References
-
- Fraser GR. Association of congenital deafness with goitre (Pendred's syndrome) a study of 207 families. Ann Hum Genet. 1965;28:201–249. - PubMed
-
- Reardon W, Coffey R, Phelps PD, Luxon LM, Stephens D, et al. Pendred syndrome–100 years of underascertainment? QJM. 1997;90:443–447. - PubMed
-
- Albert S, Blons H, Jonard L, Feldmann D, Chauvin P, et al. SLC26A4 gene is frequently involved in nonsyndromic hearing impairment with enlarged vestibular aqueduct in Caucasian populations. Eur J Hum Genet. 2006;14:773–779. - PubMed
Publication types
MeSH terms
Substances
Grants and funding
LinkOut - more resources
Full Text Sources
Medical
Molecular Biology Databases
