Comparative Study
. 2010 Nov 17;5(11):e15471.
doi: 10.1371/journal.pone.0015471.

A comparative analysis shows morphofunctional differences between the rat and mouse melanin-concentrating hormone systems

Affiliations
Comparative Study

A comparative analysis shows morphofunctional differences between the rat and mouse melanin-concentrating hormone systems

Sophie Croizier et al. PLoS One. .

Abstract

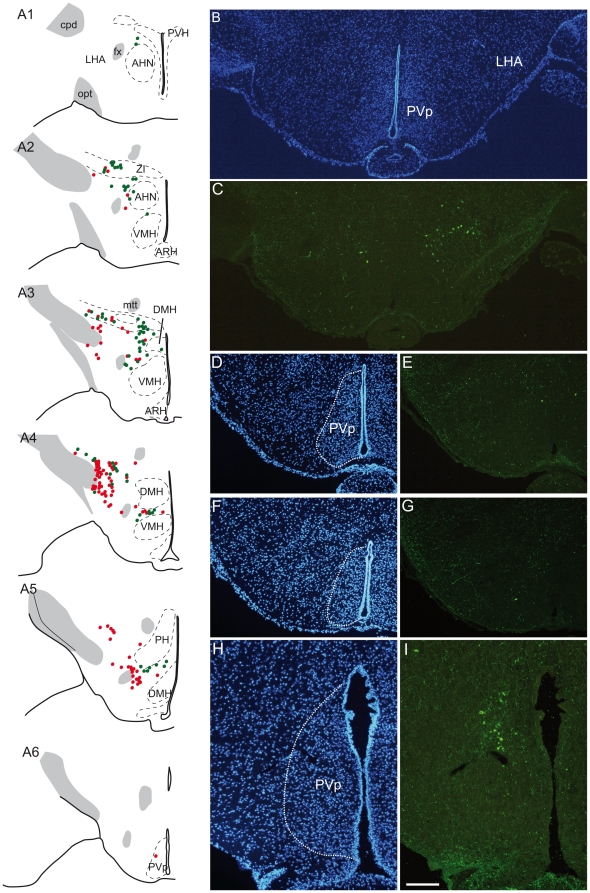
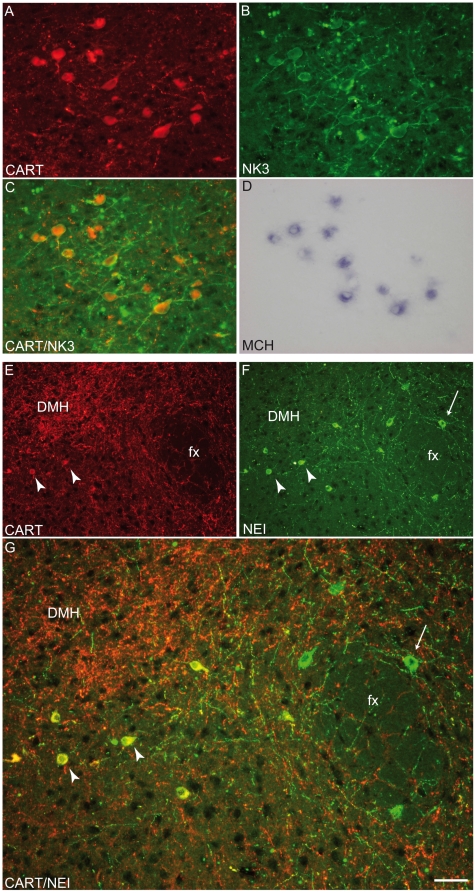
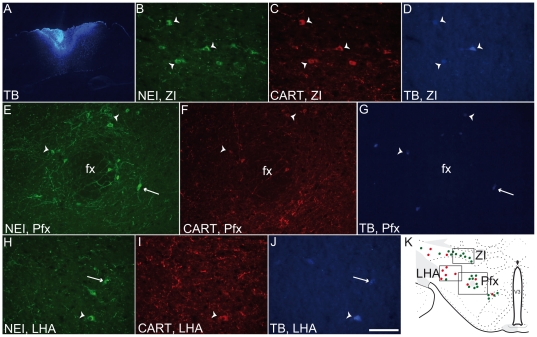
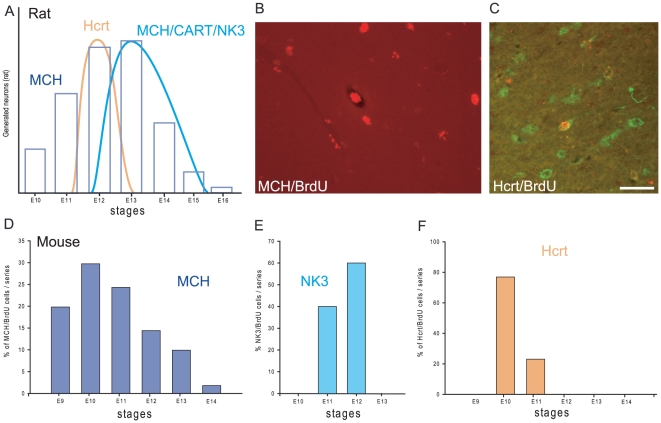
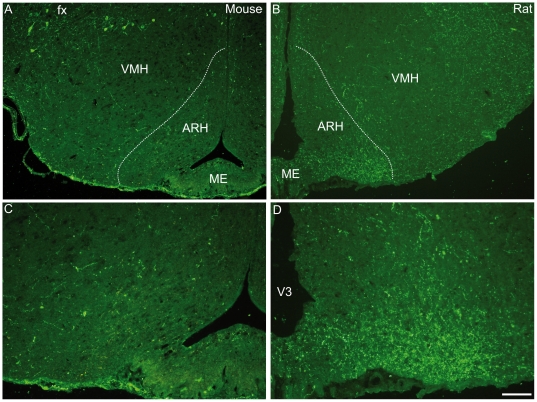
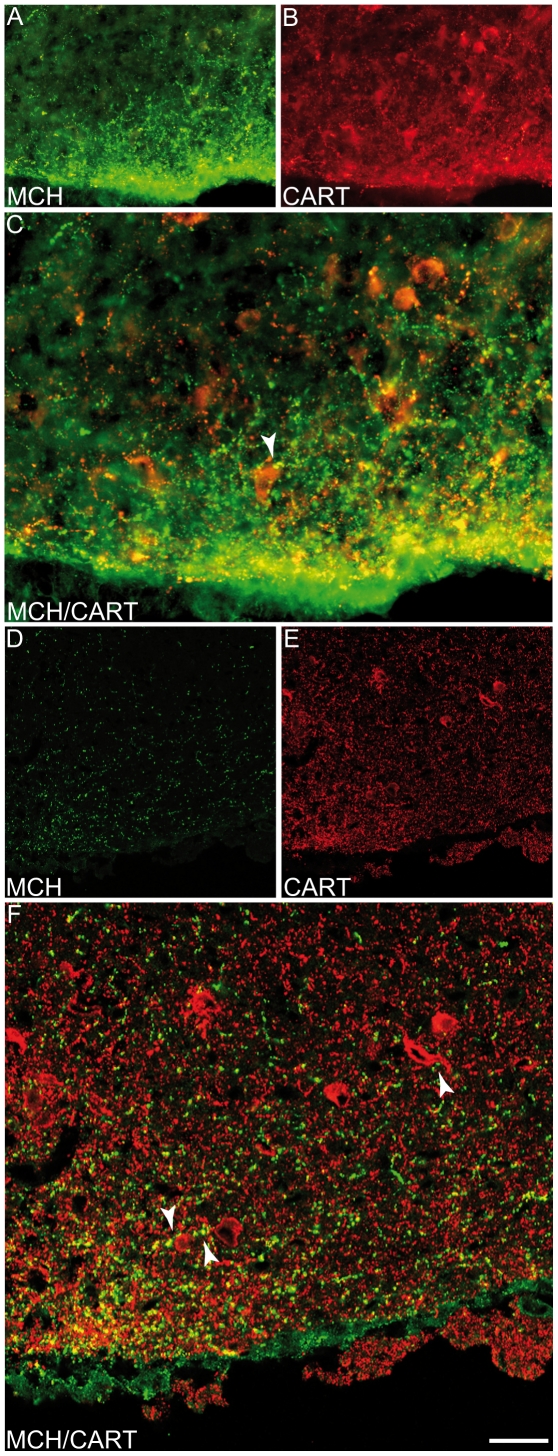
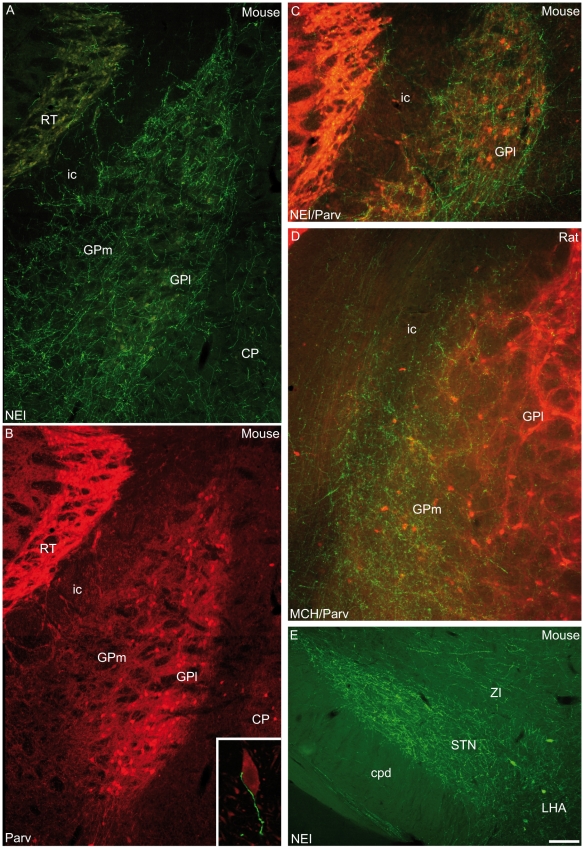
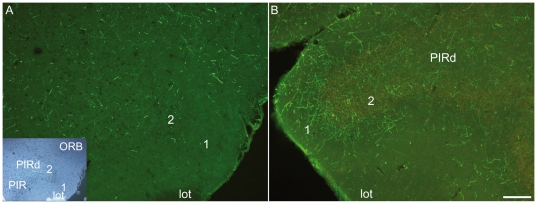
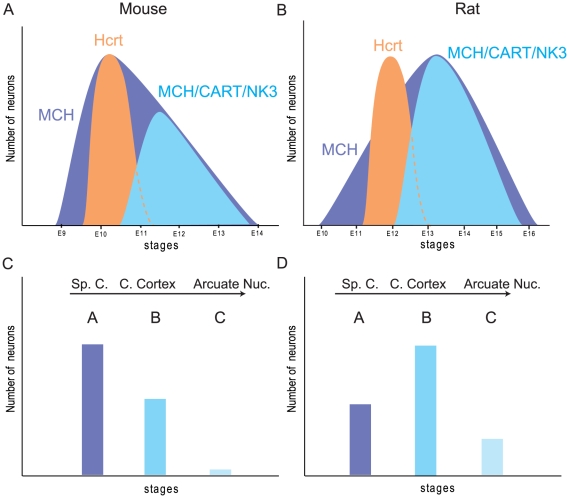
Sub-populations of neurons producing melanin-concentrating hormone (MCH) are characterized by distinct projection patterns, birthdates and CART/NK3 expression in rat. Evidence for such sub-populations has not been reported in other species. However, given that genetically engineered mouse lines are now commonly used as experimental models, a better characterization of the anatomy and morphofunctionnal organization of MCH system in this species is then necessary. Combining multiple immunohistochemistry experiments with in situ hybridization, tract tracing or BrdU injections, evidence supporting the hypothesis that rat and mouse MCH systems are not identical was obtained: sub-populations of MCH neurons also exist in mouse, but their relative abundance is different. Furthermore, divergences in the distribution of MCH axons were observed, in particular in the ventromedial hypothalamus. These differences suggest that rat and mouse MCH neurons are differentially involved in anatomical networks that control feeding and the sleep/wake cycle.


Conflict of interest statement

Competing Interests: The authors have declared that no competing interests exist.

Figures

Figure 1
Figure 1. Distribution of MCH perikarya in the mouse hypothalamus.
(A) Distribution of MCH/CART-positive and MCH-positive/CART-negative neurons, (respectively represented by green and red dots) on a series of line drawings of coronal sections through the mouse hypothalamus and arranged from rostral to caudal (A1 to A6). (B–G) Photomicrographs to illustrate the distribution of caudal-most MCH perikarya labeled by the sMCH-AS (C, E, G) at the level of the posterior periventricular nucleus (PVp). Sections were counterstained with DAPI to precisely identify cytoarchitectonic borders of the nucleus (B, D, F). Very few MCH perikarya are seen within this nucleus. (H–I) By contrast in rat, a group of MCH perikarya is labeled within the borders of the PVp. These neurons form a clear cell condensation. AHN: anterior hypothalamic nucleus, ARH: arcuate nucleus hypothalamus, cpd: cerebral peduncle, DMH: dorsomedial nucleus hypothalamus, fx: fornix, LHA: lateral hypothalamic area, mtt: mammillothalamic tract, opt: optic tract, PH: posterior hypothalamic nucleus, PVH: paraventricular nucleus hypothalamus, PVp: posterior periventricular nucleus hypothalamus, VMH: ventromedial nucleus hypothalamus, V3: third ventricle, ZI: zona incerta.
Figure 2
Figure 2. Co-expression of MCH/NEI, CART and NK3.
(A–D) Photomicrographs to illustrate the co-expression of NK3 receptor and CART peptide by immunohistochemistry as well as the preproMCH (ppMCH) mRNA using in situ hybridization. CART and NK3 were first detected by immunofluorescence (A and B respectively, C). Then, the presence of the ppMCH mRNA in the same cell bodies was verified by in situ hybridization (D). All MCH positive neurons that expressed CART also contained NK3. (E–G) Photomicrographs showing NEI/CART (arrowheads) or NEI (arrows) labeled neurons. Most NEI-positive neurons localized medially to the fornix expressed CART. NEI and CART co-expression was less frequent lateral to the fornix (G). DMH: dorsomedial nucleus hypothalamus, fx: fornix.
Figure 3
Figure 3. Origin of MCH projections in the mouse cortex.
(A) Photomicrograph illustrating a true blue (TB) injection site in the mouse medial cerebral cortex. (B–J) Photomicrographs showing NEI/CART labeled neurons containing true blue (arrowheads) or neurons containing both NEI and true blue but not CART (arrows). Triple labeled cells were abundant in the zona incerta (ZI) and medial perifornical regions (Pfx), while double labeled cells were mostly found in the lateral hypothalamic area (LHA). The schem in K shows the localization of the three regions and a schematic distribution of NEI/CART and NEI positive/CART negative neurons represented by green and red dots respectively. fx: fornix, V3: third ventricle.
Figure 4
Figure 4. MCH neuron genesis in the mouse hypothalamus.
(A) Histogram summarizing precedent findings in the rat concerning the genesis of MCH, MCH/CART/NK3 and Hcrt neurons in the hypothalamus ,. (B–F) A similar study combining BrdU, immunohistochemistry and in situ hybridization was conducted in mouse to compare the birthdates of MCH and Hcrt neurons. (B) Photomicrograph illustrating a neuron double-labeled for BrdU (red immunohistochemistry) and MCH (in situ hybridization). (C) Dual immunofluorescence to identify Hcrt (green) and BrdU in the same neurons. Only neurons displaying a densely BrdU-labeled nucleus were taken into consideration. (D–F) Histograms of MCH/BrdU, NK3/BrdU and Hcrt/BrdU neurons. MCH/BrdU positive neurons are seen from E9 to E14, with a peak at E10 (D). NK3/BrdU positive cells in the zona incerta/LHA were observed only at E11 and E12 (E). On the same material, double labeled Hcrt/BrdU perikarya were observed mainly at E10 (F). LHA: lateral hypothalamic area.
Figure 5
Figure 5. MCH axons in the arcuate nucleus.
Photomicrographs illustrating the MCH labeling in the arcuate nucleus (ARH) in mouse (A and B) or rat (C and D) hypothalamus. In mouse, few MCH fibers were observed in the ARH whereas a dense MCH inputs were present in a ventral part of the rat ARH.
Figure 6
Figure 6. Innervation of POMC neurons by MCH axons.
Standard immunofluorescence (A–C) or confocal microscopy (D–F) to illustrate double labeling for CART and MCH in the rat ventral ARH. MCH axons appeared to make synaptic contacts on POMC cells that were labeled by the CART-AS.
Figure 7
Figure 7. MCH axons in the Globus Pallidus.
(A–C) Photomicrographs to illustrate the MCH innervation of the mouse globus pallidus (GP). MCH axons labeled by the NEI-AS (A) or sMCH-AS (C, green labeling) are observed throughout the nucleus. Medial (GPm) and lateral (GPl) parts are innervated. GPm contains few parvalbumine (Parv)-containing cell bodies, while GPl contains many such neurons (B, red labeling in C). MCH axons are seen close to Parv neurons in the GPl: insert in B is a confocal image showing a MCH axon (green) innervating a Parv perikarya (red). (D) Double labeling for MCH/Parv in rat globus pallidus. Only medial regions of the GP were innervated by MCH fibers, while lateral parts of the nucleus do not contain a MCH innervation. (E) Photomicrograph showing intense NEI innervations of the mouse subthalamic nucleus (STN).
Figure 8
Figure 8. MCH axons in the piriform cortex.
Photomicrographs illustrating the MCH innervation of the piriform cortex (PIR) in mouse (A) and in rat (B). Insert in A is a darkfield wiev of the same section for cytoarchitectonic purposes. The indentation of this cortical field just dorsal to the lateral olfactory tract (lot) is very clear. In rat, many MCH fibers are observed in layers 1 and 2 of the dorsal piriform area, whereas very few are seen in mouse. PIR: piriform cortical field, PIRd: dorsal region of the piriform area, ORB: orbital area.
Figure 9
Figure 9. Diagrams summarizing differences between rat and mouse MCH systems.
Summary diagrams to compare the genesis of MCH, Hcrt neuron populations and MCH/CART/NK3 sub-population. In mouse (A), both peaks of MCH and Hcrt production are at E10. MCH/CART/NK3 neurons are generated after E10 and constitute less than half of the whole MCH population. In rat (B), the peak of MCH production is late compared to the peak of Hcrt genesis, and in this species MCH/CART/NK3 neurons form 2/3 of the whole MCH population. It can be hypothesize that these different patterns of genesis have an impact on the organization of the MCH neuron system in the two species: in mouse (C), MCH type A neurons is preeminent compared to MCH type B neurons. On the contrary, MCH type B neurons is better represented in rat (D), and a group of lastly generated cells with a periventricular distribution and projections in the arcuate nucleus (MCH type C neurons) can be observed. This last group is lacking in mouse.

Similar articles

Cited by

References

    1. Shimada M, Tritos NA, Lowell BB, Flier JS, Maratos-Flier E. Mice lacking melanin-concentrating hormone are hypophagic and lean. Nature. 1998;396:670–674. - PubMed
    1. Ludwig DS, Tritos NA, Mastaitis JW, Kulkarni R, Kokkotou E, et al. Melanin-concentrating hormone overexpression in transgenic mice leads to obesity and insulin resistance. J Clin Invest. 2001;107:379–386. - PMC - PubMed
    1. Griffond B, Baker BI. Cell and molecular cell biology of melanin-concentrating hormone. Int Rev Cytol. 2002;213:233–277. - PubMed
    1. Hanriot L, Camargo N, Courau AC, Leger L, Luppi PH, et al. Characterization of the melanin-concentrating hormone neurons activated during paradoxical sleep hypersomnia in rats. J Comp Neurol. 2007;505:147–157. - PubMed
    1. Chung S, Hopf FW, Nagasaki H, Li CY, Belluzzi JD, et al. The melanin-concentrating hormone system modulates cocaine reward. Proc Natl Acad Sci U S A. 2009;106:6772–6777. - PMC - PubMed

Publication types

MeSH terms