. 2010 Nov 16;5(11):e14020.
doi: 10.1371/journal.pone.0014020.

Alterations in mGluR5 expression and signaling in Lewy body disease and in transgenic models of alpha-synucleinopathy--implications for excitotoxicity

Affiliations

Alterations in mGluR5 expression and signaling in Lewy body disease and in transgenic models of alpha-synucleinopathy--implications for excitotoxicity

Diana L Price et al. PLoS One. .

Retraction in

Abstract

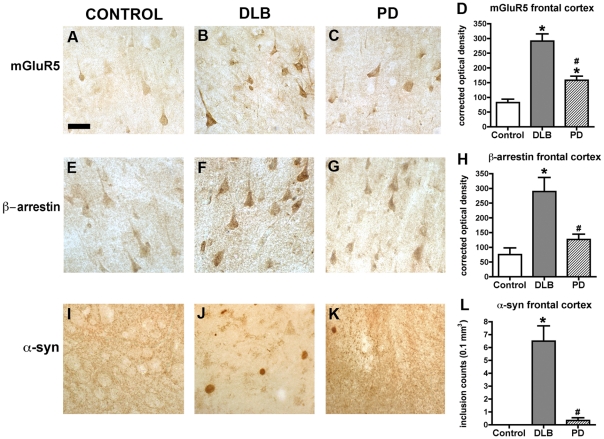
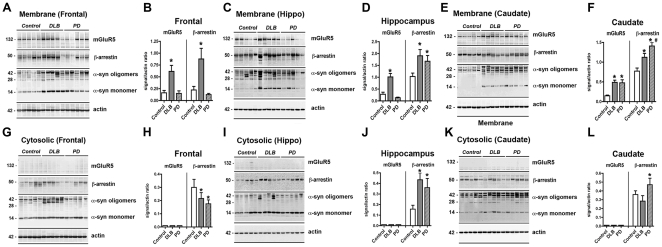
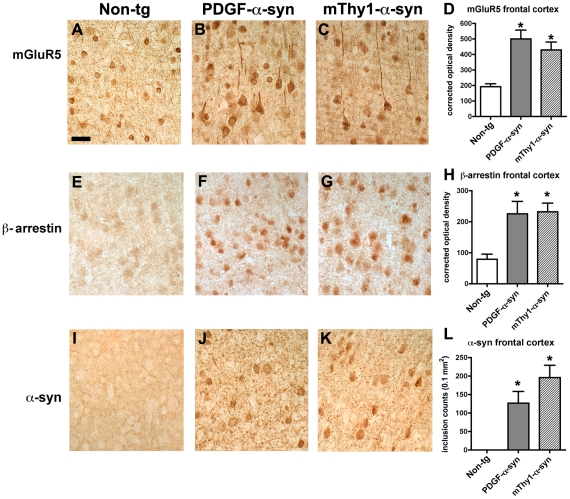
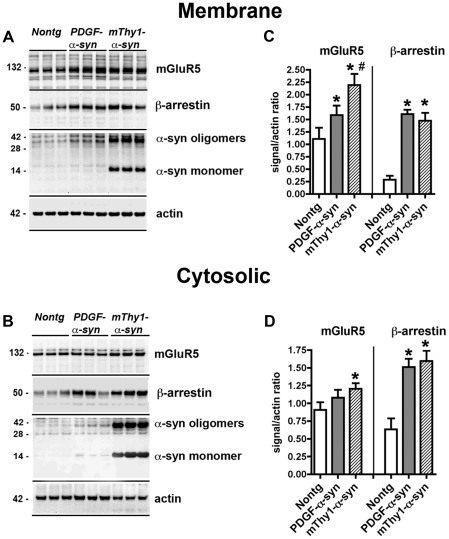
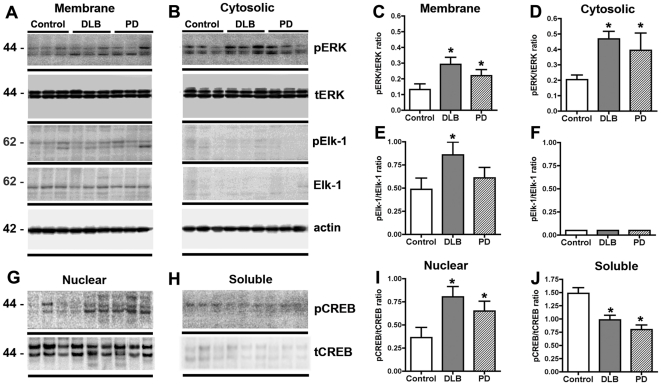
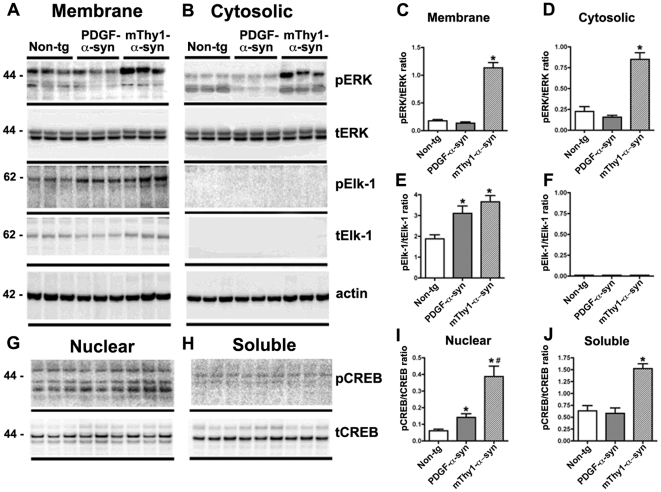
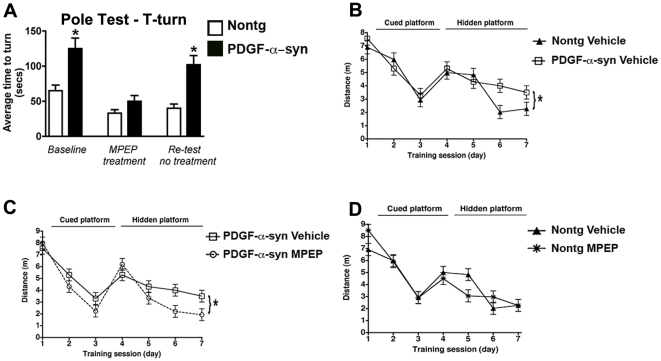
Dementia with Lewy bodies (DLB) and Parkinson's Disease (PD) are neurodegenerative disorders of the aging population characterized by the abnormal accumulation of alpha-synuclein (alpha-syn). Previous studies have suggested that excitotoxicity may contribute to neurodegeneration in these disorders, however the underlying mechanisms and their relationship to alpha-syn remain unclear. For this study we proposed that accumulation of alpha-syn might result in alterations in metabotropic glutamate receptors (mGluR), particularly mGluR5 which has been linked to deficits in murine models of PD. In this context, levels of mGluR5 were analyzed in the brains of PD and DLB human cases and alpha-syn transgenic (tg) mice and compared to age-matched, unimpaired controls, we report a 40% increase in the levels of mGluR5 and beta-arrestin immunoreactivity in the frontal cortex, hippocampus and putamen in DLB cases and in the putamen in PD cases. In the hippocampus, mGluR5 was more abundant in the CA3 region and co-localized with alpha-syn aggregates. Similarly, in the hippocampus and basal ganglia of alpha-syn tg mice, levels of mGluR5 were increased and mGluR5 and alpha-syn were co-localized and co-immunoprecipitated, suggesting that alpha-syn interferes with mGluR5 trafficking. The increased levels of mGluR5 were accompanied by a concomitant increase in the activation of downstream signaling components including ERK, Elk-1 and CREB. Consistent with the increased accumulation of alpha-syn and alterations in mGluR5 in cognitive- and motor-associated brain regions, these mice displayed impaired performance in the water maze and pole test, these behavioral alterations were reversed with the mGluR5 antagonist, MPEP. Taken together the results from study suggest that mGluR5 may directly interact with alpha-syn resulting in its over activation and that this over activation may contribute to excitotoxic cell death in select neuronal regions. These results highlight the therapeutic importance of mGluR5 antagonists in alpha-synucleinopathies.


Conflict of interest statement

Competing Interests: The authors have declared that no competing interests exist.

Figures

Figure 1
Figure 1. Immunohistochemical analysis of mGluR5, beta-arrestin and alpha-syn in the frontal cortex of Control, DLB and PD cases.
(A, B, C) Representative bright field microscopy images of mGluR5 immunoreactivity in the frontal cortex of control, DLB and PD cases respectively. (D) Analysis of mGluR5 immunoreactivity in the frontal cortex of control, DLB and PD cases. (E, F, G) Representative bright field microscopy images of beta-arrestin immunoreactivity in the frontal cortex of control, DLB and PD cases respectively. (H) Analysis of beta-arrestin immunoreactivity in the frontal cortex of control, DLB and PD cases. (I, J, K) Representative bright field microscopy images of alpha-syn immunoreactivity in the frontal cortex of control, DLB and PD cases respectively. (L) Analysis of alpha-syn immunoreactivity in the frontal cortex control, DLB and PD cases. Scale bar  = 30 µM. * Indicates a significant difference between DLB or PD cases compared to control cases (p<0.05, one-way ANOVA and post hoc Fisher). # Indicates a significant difference between DLB and PD cases (p<0.05, one-way ANOVA and post hoc Fisher) (n = 8 cases per group).
Figure 2
Figure 2. mGluR5, beta-arrestin and alpha-syn expression in frontal cortex, hippocampus and caudate of Control, DLB and PD cases.
(A) Representative immunoblot of mGluR5, beta-arrestin and alpha-syn expression levels in the membrane fraction of the frontal cortex from control, DLB and PD cases. (B) Analysis of mGluR5 and beta-arrestin levels in the membrane fraction of the frontal cortex. (C) Representative immunoblot of mGluR5, beta-arrestin and alpha-syn expression levels in the membrane fraction of the hippocampus from control, DLB and PD cases. (D) Analysis of mGluR5 and beta-arrestin levels in the membrane fraction of the hippocampus. (E) Representative immunoblot of mGluR5, beta-arrestin and alpha-syn expression levels in the membrane fraction of the caudate from control, DLB and PD cases. (F) Analysis of mGluR5 and beta-arrestin levels in the membrane fraction of the caudate. (G) Representative immunoblot of mGluR5, beta-arrestin and alpha-syn expression levels in the cytosolic fraction of the frontal cortex from control, DLB and PD cases. (H) Analysis of mGluR5 and beta-arrestin levels in the cytosolic fraction of the frontal cortex. (I) Representative immunoblot of mGluR5, beta-arrestin and alpha-syn expression levels in the cytosolic fraction of the hippocampus from control, DLB and PD cases. (J) Analysis of mGluR5 and beta-arrestin levels in the cytosolic fraction of the hippocampus. (K) Representative immunoblot of mGluR5, beta-arrestin and alpha-syn expression levels in the cytosolic fraction of the caudate from control, DLB and PD cases. (L) Analysis of mGluR5 and beta-arrestin levels in the cytosolic fraction of the caudate. * Indicates a significant difference between DLB or PD cases compared to control cases (p<0.05, one-way ANOVA and post hoc Fisher). # Indicates a significant difference between DLB and PD cases (p<0.05, one-way ANOVA and post hoc Fisher).
Figure 3
Figure 3. Immunohistochemical Analysis of mGluR5, beta-arrestin and alpha-syn in the frontal cortex of alpha-syn transgenic mice.
(A, B, C) Representative bright field microscopy images of mGluR5 immunoreactivity in the frontal cortex of non-tg, PDGF-alpha-syn and mThy1-alpha-syn tg mice, respectively. (D) Analysis of mGluR5 immunoreactivity in the frontal cortex of non-tg, PDGF-alpha-syn and mThy1-alpha-syn tg mice. (E, F, G) Representative bright field microscopy images of beta-arrestin immunoreactivity in the frontal cortex of non-tg, PDGF-alpha-syn and mThy1-alpha-syn tg mice, respectively. (H) Analysis of beta-arrestin immunoreactivity in the frontal cortex of non-tg, PDGF-alpha-syn and mThy1-alpha-syn tg mice. (I, J, K) Representative bright field microscopy images of alpha-syn immunoreactivity in the frontal cortex of non-tg, PDGF-alpha-syn and mThy1-alpha-syn tg mice, respectively. (L) Analysis of alpha-syn immunoreactivity in the frontal cortex of non-tg, PDGF-alpha-syn and mThy1-alpha-syn tg mice. Scale bar  = 30 µM. * Indicates a significant difference between alpha-syn tg mice compared to non-tg controls (p<0.05, one-way ANOVA and post hoc Fisher) (n = 8 cases per group).
Figure 4
Figure 4. mGluR5, beta-arrestin and alpha-syn expression in frontal cortex of alpha-syn transgenic mice.
(A) Representative immunoblot of mGluR5, beta-arrestin and alpha-syn expression levels in the membrane fraction of the frontal cortex from non-tg, PDGF-alpha-syn and mThy1-alpha-syn tg mice. (B) Representative immunoblot of mGluR5, beta-arrestin and alpha-syn expression levels in the cytoplasmic fraction of the frontal cortex from non-tg, PDGF-alpha-syn and mThy1-alpha-syn tg mice. (C) Analysis of mGluR5 and beta-arrestin levels in the membrane fraction of the frontal cortex. (D) Analysis of mGluR5 and beta-arrestin levels in the cytoplasmic fraction of the frontal cortex. * Indicates a significant difference between alpha-syn tg mice and non-tg controls p<0.05, one-way ANOVA and post hoc Fisher). # Indicates a significant difference between PDGF-alpha-syn and mThy1-alpha-syn tg mice (p<0.05, one-way ANOVA and post hoc Fisher)(n = 8 mice per group).
Figure 5
Figure 5. Co-immunoprecipitation and co-localization of alpha-syn and mGluR5.
(A, D, G) Representative confocal images of alpha-syn immunolabeling in the frontal cortex of control, DLB and PD cases, respectively. (B, E, H) Representative confocal images of mGluR5 immunolabeling in the frontal cortex of control, DLB and PD cases, respectively. (C, F, I) Co-localization of alpha-syn and mGluR5 immunoreactivity in the frontal cortex of control, DLB and PD cases, respectively. (J, M, P) Representative confocal images of alpha-syn immunolabeling in the frontal cortex of non-tg, PDGF-alpha-syn tg and mThy1-alpha-syn tg mice, respectively. (K, N, Q) Representative confocal images of mGluR5 immunolabeling in the frontal cortex of non-tg, PDGF-alpha-syn tg and mThy1-alpha-syn tg mice, respectively. (L, O, R) Co-localization of alpha-syn and mGluR5 immunoreactivity in the frontal cortex of non-tg, PDGF-alpha-syn tg and mThy1-alpha-syn tg mice, respectively. (S) Representative immunoblot of the co-immunoprecipitation of mGluR5 and alpha-syn using the anti-mGluR5 antibody for the pull-down and the alpha-syn antibody for the detection. (T) Representative immunoblot of the co-immunoprecipitation of mGluR5 and alpha-syn using the alpha-syn antibody for the pull-down and the anti-mGluR5 antibody for the detection. Scale bar  = 20 µM.
Figure 6
Figure 6. Immunoblot analysis of ERK, Elk-1 and CREB activity in Control, DLB and PD cases.
(A) Representative immunoblot of phospho-ERK (pERK), total ERK (tERK) phospho-ELK-1 (pELK-1) and total ELK-1 (tELK-1) expression levels in the membrane fraction from the frontal cortex of control, DLB and PD cases. (B) Representative immunoblot of pERK, tERK, pELK-1 and tELK-1 expression in the cytoplasmic fraction from the frontal cortex of control, DLB and PD cases. (C) Analysis of ERK activity (pERK/tERK ratio) in the membrane fraction. (D) Analysis of ERK activity (pERK/tERK ratio) in the cytosolic fraction. (E) Analysis of Elk-1 activity (pElk-1/tElk-1 ratio) in the membrane fraction. (F) Analysis of Elk-1 activity (pElk-1/tElk-1 ratio) in the cytosolic fraction. (G) Representative immunoblot of phospho-CREB (pCREB) and total CREB (tCREB) in the nuclear fraction from the frontal cortex of control, DLB and PD cases. (H) Representative immunoblot of pCREB and tCREB in the soluble fraction from the frontal cortex of control, DLB and PD cases. (I) Analysis of CREB activity in the nuclear fraction. (J) Analysis of CREB activity in the soluble fraction. * Indicates a significant difference between DLB or PD cases compared to control cases. (p<0.05, one-way ANOVA and post hoc Fisher) (n = 8 cases per group).
Figure 7
Figure 7. Immunoblot Analysis of ERK, Elk-1 and CREB activity in alpha-syn transgenic mice.
(A) Representative immunoblot of phospho-ERK (pERK), total ERK (tERK) phospho-ELK-1 (pELK-1) and total ELK-1 (tELK-1) expression levels in the membrane fraction from the frontal cortex of non-tg, PDGF-alpha-syn and mThy1-alpha-syn tg mice. (B) Representative immunoblot of pERK, tERK, pELK-1 and tELK-1 expression in the cytoplasmic fraction from the frontal cortex of non-tg, PDGF-alpha-syn and mThy1-alpha-syn tg mice. (C) Analysis of ERK activity (pERK/tERK ratio) in the membrane fraction. (D) Analysis of ERK activity (pERK/tERK ratio) in the cytosolic fraction. (E) Analysis of Elk-1 activity (pElk-1/tElk-1 ratio) in the membrane fraction. (F) Analysis of Elk-1 activity (pElk- 1/tElk-1 ratio) in the cytosolic fraction. (G) Representative immunoblot of phospho- CREB (pCREB) and total CREB (tCREB) in the nuclear fraction from the frontal cortex of non-tg, PDGF-alpha-syn and mThy1-alpha-syn tg mice. (H) Representative immunoblot of pCREB and tCREB in the soluble fraction from the frontal cortex of non-tg, PDGF-alpha-syn and mThy1-alpha-syn tg mice. (I) Analysis of CREB activity in the nuclear fraction. (J) Analysis of CREB activity in the soluble fraction. * Indicates a significant difference between alpha-syn tg mice and non-tg controls p<0.05, one-way ANOVA and post hoc Fisher). # Indicates a significant difference between PDGF-alpha-syn and mThy1-alpha-syn tg mice (p<0.05, one-way ANOVA and post hoc Fisher)(n = 8 mice per group).
Figure 8
Figure 8. Motor and learning/memory deficits in alpha-syn transgenic mice are ameliorated by MPEP administration.
(A) Pole test performance (T-Turn) of the non-tg and PDGF-alpha-syn tg mice, at baseline, following MPEP treatment and at re-test (no treatment). (B) Morris water maze performance of vehicle-treated non-tg and PDGF-alpha-syn tg mice. (C) Morris water maze performance of MPEP- treated PDGF-alpha-syn tg mice. (D) Morris water maze performance of MPEP-treated non-tg mice. * Indicates a significant difference between groups examined (p<0.05, one-way ANOVA and post hoc Fisher) (n = 8 per group).

Similar articles

Cited by

References

    1. McKeith IG, Dickson DW, Lowe J, Emre M, O'Brien JT, et al. Diagnosis and management of dementia with Lewy bodies: third report of the DLB Consortium. Neurology. 2005;65:1863–1872. - PubMed
    1. Shastry BS. Parkinson disease: etiology, pathogenesis and future of gene therapy. Neurosci Res. 2001;41:5–12. - PubMed
    1. Irizarry M, Growdon W, Gomez-Isla T, Newell K, George J, et al. Nigral and cortical Lewy bodies and dystrophic nigral neurites in Parkinson's disease and cortical Lewy body disease contain alphalpha-synuclein immunoreactivity. JNeuropatholExpNeurol. 1998;57:334–337. - PubMed
    1. Takeda A, Hashimoto M, Mallory M, Sundsmo M, Hansen L, et al. Abnormal distribution of the non-Ab component of Alzheimer's disease amyloid precursor/alpha-synuclein in Lewy body disease as revealed by proteinase K and formic acid pretreatment. LabInvest. 1998;78:1169–1177. - PubMed
    1. Takeda A, Mallory M, Sundsmo M, Honer W, Hansen L, et al. Abnormal accumulation of NACP/alpha-synuclein in neurodegenerative disorders. AmJPathol. 1998;152:367–372. - PMC - PubMed

Publication types

MeSH terms