

RAId_aPS: MS/MS analysis with multiple scoring functions and spectrum-specific statistics
- PMID: 21103371
- PMCID: PMC2982831
- DOI: 10.1371/journal.pone.0015438
RAId_aPS: MS/MS analysis with multiple scoring functions and spectrum-specific statistics
Abstract
Statistically meaningful comparison/combination of peptide identification results from various search methods is impeded by the lack of a universal statistical standard. Providing an E-value calibration protocol, we demonstrated earlier the feasibility of translating either the score or heuristic E-value reported by any method into the textbook-defined E-value, which may serve as the universal statistical standard. This protocol, although robust, may lose spectrum-specific statistics and might require a new calibration when changes in experimental setup occur. To mitigate these issues, we developed a new MS/MS search tool, RAId_aPS, that is able to provide spectrum-specific-values for additive scoring functions. Given a selection of scoring functions out of RAId score, K-score, Hyperscore and XCorr, RAId_aPS generates the corresponding score histograms of all possible peptides using dynamic programming. Using these score histograms to assign E-values enables a calibration-free protocol for accurate significance assignment for each scoring function. RAId_aPS features four different modes: (i) compute the total number of possible peptides for a given molecular mass range, (ii) generate the score histogram given a MS/MS spectrum and a scoring function, (iii) reassign E-values for a list of candidate peptides given a MS/MS spectrum and the scoring functions chosen, and (iv) perform database searches using selected scoring functions. In modes (iii) and (iv), RAId_aPS is also capable of combining results from different scoring functions using spectrum-specific statistics. The web link is http://www.ncbi.nlm.nih.gov/CBBresearch/Yu/raid_aps/index.html. Relevant binaries for Linux, Windows, and Mac OS X are available from the same page.
Conflict of interest statement
Figures
 (
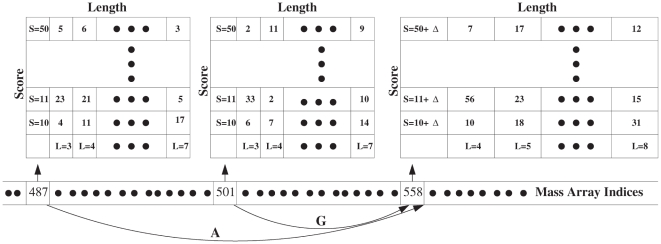
( ) peaks accumulated within the raw score histogram. Again, the factorial contribution can be added at the end prior to the construction of the final score histogram.
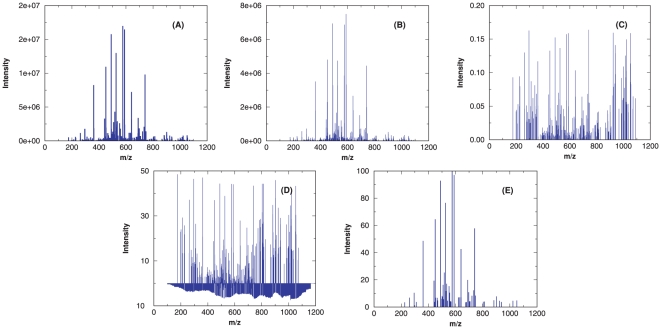
 Da. In panel (A), the original spectrum is displayed; (B) shows the processed spectrum generated by the filtering protocol of RAId_DbS scoring function; (C) exhibits the processed spectrum generated by the filtering protocol of K-score; while (D) and (E) correspond respectively to the processed spectra produced by XCorr and Hyperscore.
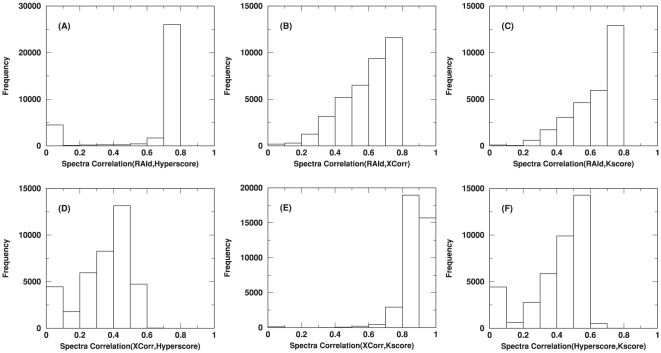
 raw centroid spectra from the ISB data set . Each raw spectrum will have four different processed spectra come from each of the four different filtering strategies. The mass fragments of every filtered spectrum are then read to a mass grid. The spectrum is then viewed as a vector with non-vanishing components only at the populated component/mass indices. One then normalizes each filtered spectrum vector to unit length. An inner product of any two filtered spectral vectors represents the correlation between them. When the spectral quality does not pass a method-dependent threshold, the corresponding filtering protocol may turn the raw spectrum into a null spectrum without further searching the database. For a given pair of filtering methods and a raw spectrum, if each of the two filtering methods produces a nonempty filtered spectrum, one may turn those filtered spectra into spectral vectors and compute their inner product, i.e., their correlation. For each pair of filtering methods, these inner products are accumulated and plotted as a correlation histogram. All six pairwise combinations are shown.
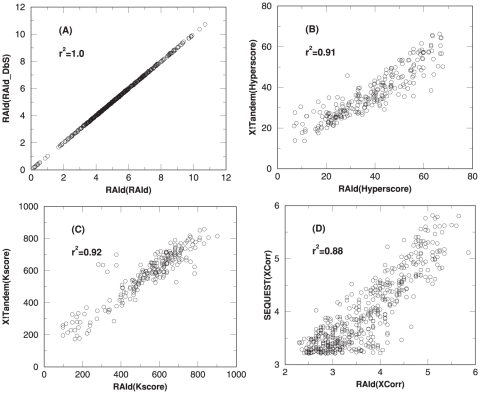
 spectra, panel A is for the RAId score. Panel B is for Hyperscore and contains
  spectra. The result of K-score is shown in panel C with
  spectra. Shown with
  spectra, panel D documents the results for XCorr.
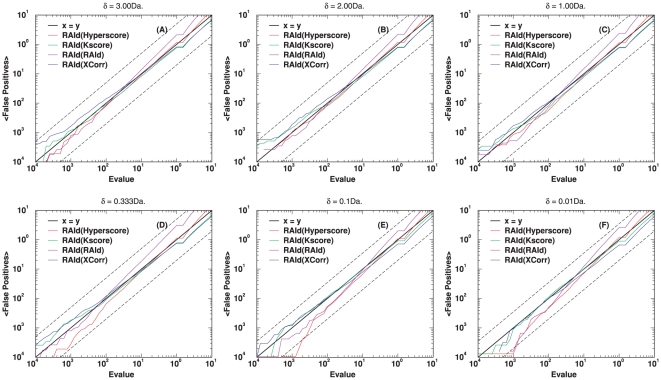
 -value and the textbook definition is examined using centroid data (A1–A4 subsets of ISB data set). The random database size used is 500 MB. The molecular weight range considered while searching the database is
  . In each panel, the dashed lines, corresponding to
  and
and  , are used to provide a visual guide regarding how close/off the experimental curves are from the theoretical curve.
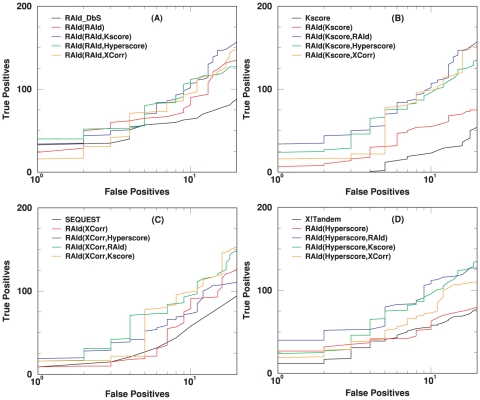
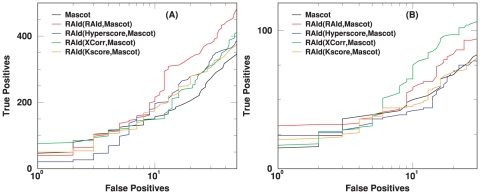
 candidates using SP score. As shown in panel (C), for centroid data there is an advantage to filtering candidates with the SP score. However, it is also seen that by combining XCorr with either RAId score or Hyperscore, equally good results can be attained without introducing the SP score heuristics.
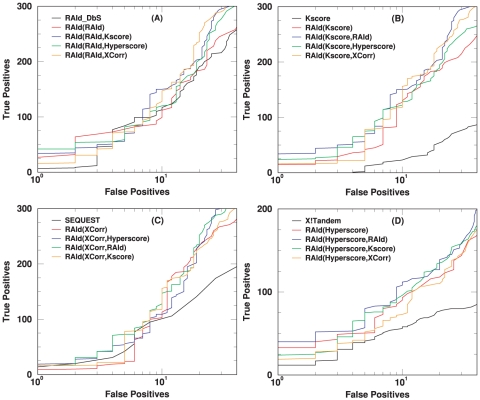
 candidates using SP score. As shown in panel (C), for centroid data there is advantage to filter candidates with the SP score. However, it is also seen that by combining XCorr with either RAId score or Hyperscore, equally good results can be attained without introducing the SP score heuristics.
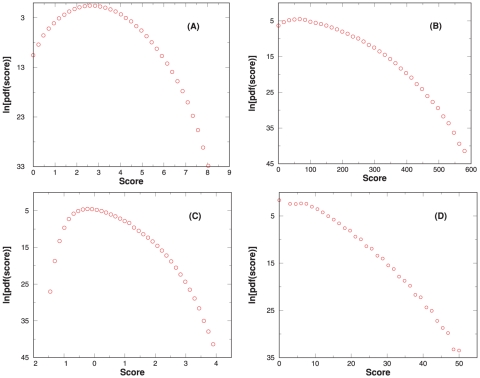
 spectrum of parent ion mass
  Da is queried with default parameters, and the resulting score PDF for RAId, K-score, XCorr, and Hyperscore are shown respectively in panels A, B, C, and D. The number of APP within
  3Da of parent ion mass is about
  .
.
 -value of Mascot with the
  -value obtained from RAId_aPS when either RAId score, Hyperscore, K-score or XCorr is used.
Similar articles
-
RAId_DbS: mass-spectrometry based peptide identification web server with knowledge integration.BMC Genomics. 2008 Oct 27;9:505. doi: 10.1186/1471-2164-9-505. BMC Genomics. 2008. PMID: 18954448 Free PMC article.
-
RAId: Knowledge-Integrated Proteomics Web Service with Accurate Statistical Significance Assignment.Proteomics. 2019 Jul;19(14):e1800367. doi: 10.1002/pmic.201800367. Proteomics. 2019. PMID: 30908818 Free PMC article.
-
Robust accurate identification of peptides (RAId): deciphering MS2 data using a structured library search with de novo based statistics.Bioinformatics. 2005 Oct 1;21(19):3726-32. doi: 10.1093/bioinformatics/bti620. Epub 2005 Aug 16. Bioinformatics. 2005. PMID: 16105903
-
Protocol for Standardizing High-to-Moderate Abundance Protein Biomarker Assessments Through an MRM-with-Standard-Peptides Quantitative Approach.Adv Exp Med Biol. 2016;919:515-530. doi: 10.1007/978-3-319-41448-5_24. Adv Exp Med Biol. 2016. PMID: 27975233 Review.
-
Modification Site Localization in Peptides.Adv Exp Med Biol. 2016;919:243-247. doi: 10.1007/978-3-319-41448-5_13. Adv Exp Med Biol. 2016. PMID: 27975222 Review.
Cited by
-
Confidence assignment for mass spectrometry based peptide identifications via the extreme value distribution.Bioinformatics. 2016 Sep 1;32(17):2642-9. doi: 10.1093/bioinformatics/btw225. Epub 2016 Apr 29. Bioinformatics. 2016. PMID: 27153659 Free PMC article.
-
A graphical user interface for RAId, a knowledge integrated proteomics analysis suite with accurate statistics.BMC Res Notes. 2018 Mar 15;11(1):182. doi: 10.1186/s13104-018-3289-6. BMC Res Notes. 2018. PMID: 29544540 Free PMC article.
-
On the importance of well-calibrated scores for identifying shotgun proteomics spectra.J Proteome Res. 2015 Feb 6;14(2):1147-60. doi: 10.1021/pr5010983. Epub 2014 Dec 17. J Proteome Res. 2015. PMID: 25482958 Free PMC article.
-
Peptide identification by tandem mass spectrometry with alternate fragmentation modes.Mol Cell Proteomics. 2012 Sep;11(9):550-7. doi: 10.1074/mcp.R112.018556. Epub 2012 May 17. Mol Cell Proteomics. 2012. PMID: 22595789 Free PMC article. Review.
-
Improving peptide identification sensitivity in shotgun proteomics by stratification of search space.J Proteome Res. 2013 Jun 7;12(6):2571-81. doi: 10.1021/pr301139y. Epub 2013 May 29. J Proteome Res. 2013. PMID: 23668635 Free PMC article.
References
-
- Prakash A, Piening B, Whiteaker J, Zhang H, Shaffer SA, et al. Assessing bias in experiment design for large scale mass spectrometry-based quantitative proteomics. Mol Cell Proteomics. 2007;6:1741–1748. - PubMed
-
- Taylor CF, Paton NW, Lilley KS, Binz PA, Julian RK, et al. The minimum information about a proteomics experiment (MIAPE). Nat Biotechnol. 2007;25:887–893. - PubMed
-
- Oberg AL, Vitek O. Statistical Design of Quantitative Mass spectrometry-Based Proteomics Experiments. J Proteome Res. 2009;8:2144–2156. - PubMed
-
- Keller A, Nesvizhskii AI, Kolker E, R A. Empirical statistical model to estimate the accuracy of peptide identifications made by ms/ms and database search. Anal Chem. 2002;74:5383–5392. - PubMed
Publication types
MeSH terms
Substances
Grants and funding
LinkOut - more resources
Full Text Sources
Miscellaneous
