. 2010 Nov 16;5(11):e15477.
doi: 10.1371/journal.pone.0015477.

Multiple events lead to dendritic spine loss in triple transgenic Alzheimer's disease mice

Affiliations

Multiple events lead to dendritic spine loss in triple transgenic Alzheimer's disease mice

Tobias Bittner et al. PLoS One. .

Abstract

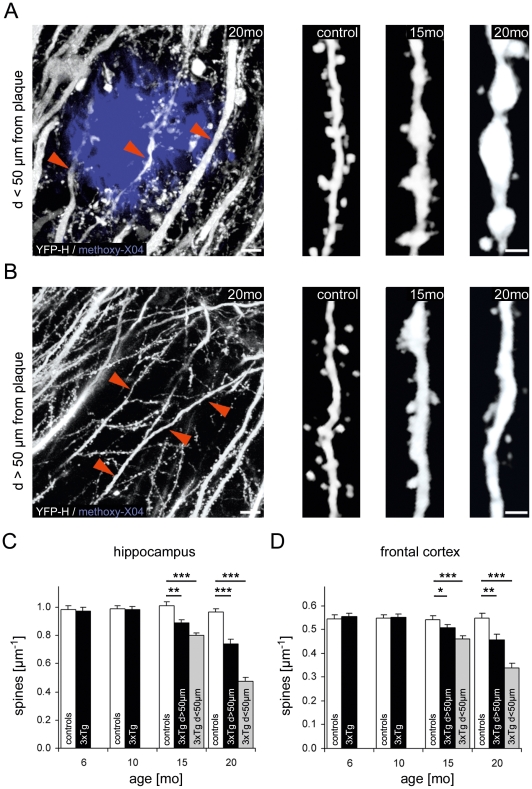
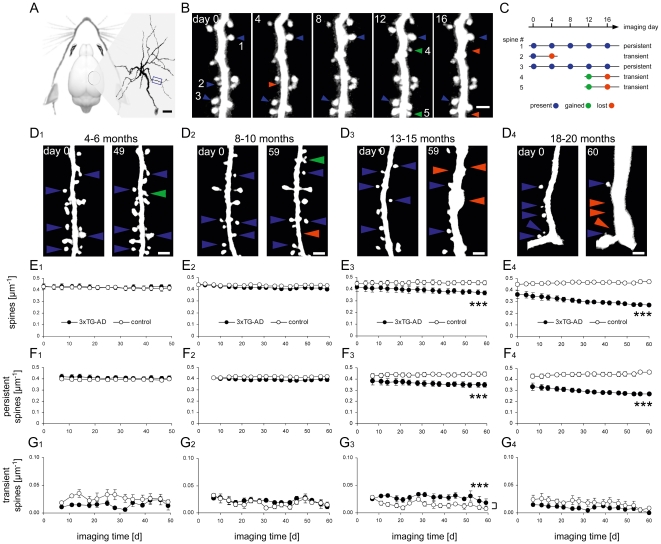
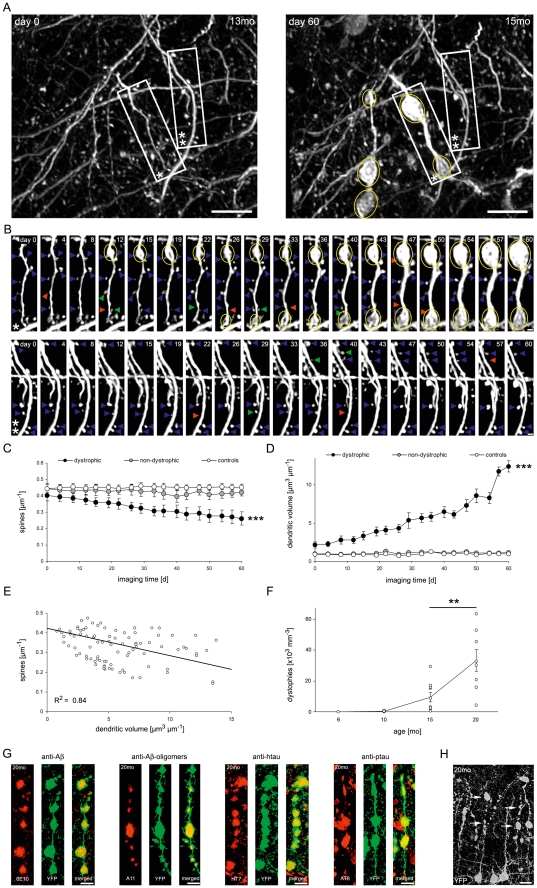
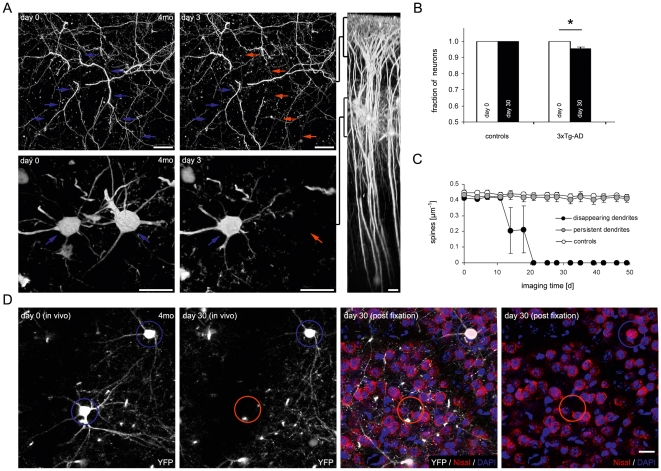
The pathology of Alzheimer's disease (AD) is characterized by the accumulation of amyloid-β (Aβ) peptide, hyperphosphorylated tau protein, neuronal death, and synaptic loss. By means of long-term two-photon in vivo imaging and confocal imaging, we characterized the spatio-temporal pattern of dendritic spine loss for the first time in 3xTg-AD mice. These mice exhibit an early loss of layer III neurons at 4 months of age, at a time when only soluble Aβ is abundant. Later on, dendritic spines are lost around amyloid plaques once they appear at 13 months of age. At the same age, we observed spine loss also in areas apart from amyloid plaques. This plaque independent spine loss manifests exclusively at dystrophic dendrites that accumulate both soluble Aβ and hyperphosphorylated tau intracellularly. Collectively, our data shows that three spatio-temporally independent events contribute to a net loss of dendritic spines. These events coincided either with the occurrence of intracellular soluble or extracellular fibrillar Aβ alone, or the combination of intracellular soluble Aβ and hyperphosphorylated tau.


Conflict of interest statement

Competing Interests: The authors have declared that no competing interests exist.

Figures

Figure 1
Figure 1. Dendritic spine density is reduced in the hippocampus and frontal cortex from 15 months on.
(A, B) High-resolution images of dendrites and dendritic spines in the vicinity of (d<50 µm) and distant to (d>50 µm) amyloid plaques in the hippocampus. Scale bars: 10 µm (overviews); 2 µm (close ups) (C, D) In the hippocampus (C) and frontal cortex (D) of 15 and 20 month-old 3xTg-AD mice, the dendritic spine density was significantly reduced in areas close to (grey columns) and distant from (black columns) amyloid plaques compared to non-AD transgenic control mice (white) (* P<0.05, ** P<0.01, *** P<0.001, Student's t-test, n = 50 dendrites in n = 5 mice per group). The dendritic spine density was unchanged at 6 and 10 months of age. Error bars indicate +S.E.M.
Figure 2
Figure 2. Dendritic spine density progressively declines in the somatosensory cortex from 13 months on.
(A) A cranial window was implanted over the somatosensory cortex to perform long-term two-photon in vivo imaging of neurons, dendrites, and dendritic spines. (B) High-resolution time-lapse images of a dendritic region (blue box in A) over 16 days. Present spines (blue arrows), lost spines (red arrows), and gained spines (green arrows) are exemplarily marked. (C) Classification of the 5 spines marked in B in categories of persistent (lifetime ≥8 days) and transient spines (lifetime <8 days). (D) Start and end point images of a 49-60 day in vivo imaging period of dendrites and dendritic spines in the somatosensory cortex of 4–6 (D1), 8–10 (D2), 13–15 (D3), and 18–20 (D4) months old 3xTg-AD mice. Color code of arrows as in B. (E–G) Dendritic spines imaged in 4–6 (1), 8–10 (2), 13–15 (3), and 18–20 (4) months old 3xTg-AD mice and age-matched non-AD transgenic control mice over a 49–60 day in vivo imaging period. (E) Dendritic spine density, (F) density of persistent dendritic spines, (G) density of transient dendritic spines. Each circle indicates one imaging time point ±S.E.M. (*** P<0.001, repeated measures ANOVA (E and F) or Wilcoxon Rank Sum Test (G), n = 4 mice per group). Scale bars: 20 µm (A), 2 µm (B and D);
Figure 3
Figure 3. Dendritic spine density is reduced exclusively at dystrophic, soluble Aβ and hyperphosphorylated tau accumulating dendrites.
(A, B) Time-lapse images of dystrophic and non-dystrophic dendrites over 60 days. Dendritic dystrophies (yellow circles), stable (blue arrows), lost (red arrows), and gained dendritic spines (green arrows) at corresponding time-points are labeled. (C, D) Changes in dendritic spine density (C) and dendritic volume (D) over 60 days at dystrophic, non-dystrophic and control dendrites in 13–20 month-old mice. Note that the dendritic spine density of dystrophic dendrites significantly decreased over time, while the mean dendritic volume of the same dendrites significantly increased (*** P<0.001, repeated measures ANOVA, n = 4 mice per group). Each circle represents one imaging time-point. (E) In 3xTg-AD mice, the dendritic volume and spine density are inversely correlated (R2 = 0.84, P<0.001, n = 4 mice), indicating a relationship between both events. (F) The mean number of dystrophic dendrites per volume significantly increased from 15 to 20 months of age (** P<0.01, Student's t-test, n = 8–10 mice per age group). (G) Dendritic dystrophies in the somatosensory cortex were labeled positive for antibodies 6E10, A11, HT7, and AT8 via immunofluorescence staining. Co-localization (yellow) of each antibody (red) and YFP (green) in merged images. (H) Cortical section of a 20 month-old 3xTg-AD mouse expressing YFP in cortical neurons that has not previously been imaged in vivo. Dystrophic dendrites (white arrows) are abundant in cortical layers 1–3. Error bars: ±S.E.M. Scale bars: 10 µm (A, G, H) 2 µm (B),
Figure 4
Figure 4. Early layer III neuron loss leads to spine loss.
(A) Two-photon in vivo images of the identical cortical region of a 4 months old 3xTg-AD mouse showing a selective disappearance of an apical dendrite in layer 1–2 (red arrows) and the corresponding layer III neuron after 3 days, while a neighboring dendrite and neuron persisted (blue arrows). Scale bars: 20 µm. (B) Neuron loss in a 30 day interval was exclusively detected in 3xTg-AD mice compared to control mice (* P<0.05, Student's t-test, n = 1,200 neurons). Error bars indicate +S.E.M. (C) Mean dendritic spine density of disappearing dendrites remained unchanged before the loss of the neuron. Dendritic spine density remained at a level comparable to the spine density of persistent dendrites of the same 4–6 months old 3xTg-AD mice and controls (n = 10 dendrites per group). Error bars indicate ±S.E.M. (D) Two-photon in vivo images of the same layer III neurons in a 4 months old 3xTg-AD mouse and 30 days later. A single neuron disappeared after 30 days (red circle) while a neighboring YFP positive neuron persisted (blue circle). After the neuron loss occurred, the brain was paraformaldehyde fixed, cut in 100 µm thick sections, and the nuclei were labeled with DAPI while neurons were selectively labeled with Nissl-Red. Neither DAPI, nor Nissl staining was detected at the position where neuron loss was previously detected in the in vivo image (red circle) while the persisting neuron was labeled with DAPI and Nissl (blue circle). Scale bars: 20 µm.

References

    1. Terry RD, Masliah E, Salmon DP, Butters N, DeTeresa R, et al. Physical basis of cognitive alterations in Alzheimer's disease: synapse loss is the major correlate of cognitive impairment. Ann Neurol. 1991;30:572–580. - PubMed
    1. Selkoe DJ. Alzheimer's disease is a synaptic failure. Science. 2002;298:789–791. - PubMed
    1. Davies CA, Mann DMA, Sumpter PQ, Yates PO. A Quantitative Morphometric Analysis of the Neuronal and Synaptic Content of the Frontal and Temporal Cortex in Patients with Alzheimers-Disease. Journal of the Neurological Sciences. 1987;78:151–164. - PubMed
    1. Masliah E, Terry RD, Deteresa RM, Hansen LA. Immunohistochemical Quantification of the Synapse-Related Protein Synaptophysin in Alzheimer-Disease. Neurosci Lett. 1989;103:234–239. - PubMed
    1. DeKosky ST, Scheff SW. Synapse Loss in Frontal-Cortex Biopsies in Alzheimers-Disease - Correlation with Cognitive Severity. Ann Neurol. 1990;27:457–464. - PubMed

Publication types

MeSH terms