. 2010 Nov 12;5(11):e15460.
doi: 10.1371/journal.pone.0015460.

Automated high-content live animal drug screening using C. elegans expressing the aggregation prone serpin α1-antitrypsin Z

Affiliations

Automated high-content live animal drug screening using C. elegans expressing the aggregation prone serpin α1-antitrypsin Z

Sager J Gosai et al. PLoS One. .

Abstract

The development of preclinical models amenable to live animal bioactive compound screening is an attractive approach to discovering effective pharmacological therapies for disorders caused by misfolded and aggregation-prone proteins. In general, however, live animal drug screening is labor and resource intensive, and has been hampered by the lack of robust assay designs and high throughput work-flows. Based on their small size, tissue transparency and ease of cultivation, the use of C. elegans should obviate many of the technical impediments associated with live animal drug screening. Moreover, their genetic tractability and accomplished record for providing insights into the molecular and cellular basis of human disease, should make C. elegans an ideal model system for in vivo drug discovery campaigns. The goal of this study was to determine whether C. elegans could be adapted to high-throughput and high-content drug screening strategies analogous to those developed for cell-based systems. Using transgenic animals expressing fluorescently-tagged proteins, we first developed a high-quality, high-throughput work-flow utilizing an automated fluorescence microscopy platform with integrated image acquisition and data analysis modules to qualitatively assess different biological processes including, growth, tissue development, cell viability and autophagy. We next adapted this technology to conduct a small molecule screen and identified compounds that altered the intracellular accumulation of the human aggregation prone mutant that causes liver disease in α1-antitrypsin deficiency. This study provides powerful validation for advancement in preclinical drug discovery campaigns by screening live C. elegans modeling α1-antitrypsin deficiency and other complex disease phenotypes on high-content imaging platforms.


Conflict of interest statement

Competing Interests: The authors have declared that no competing interests exist.

Figures

Figure 1
Figure 1. Animal (object) detection using the ArrayScan VTI.
Thirty-six adult or mixed stage animals were dispensed into 384-well plates, imaged and analyzed using the ArrayScan VTI and SpotDetector BioApplication. (A) A brightfield image of adult animals. (B) SpotDetector correctly identified all the worms in the field as indicated by the blue outline. (C) A representative brightfield image of a well containing 36 animals with a predetermined percentage (0, 25, 50, 75 and 100%) of adults sorted into a 384-well plate. (D) SpotDetector was optimized to identify large (L4 and adult stage) worms (blue outline) and exclude smaller (L1, L2 and L3 stage) worms (orange outline). (E) Correlation between the percent of adults actually sorted per well in (D) vs. the percent of adults as determined by SpotDetector. The slope and goodness-of-fit (r 2) of the linear regression were 0.72 and 0.85, respectively. The slope of the line was significantly different to 1 (P<0.05). Scale bar, 450 µm.
Figure 2
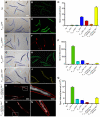
Figure 2. Automated detection and quantification of cells, tissues, subcellular protein aggregates or autophagy in individual animals.
(A–J) The SpotDetector BioApplication was used to identify and quantitate different types of transgene expression (left of panels) in adult animals. The brightfield channel (left panels) was used to discriminate between complete adult animals (outlined in blue) and debris or incomplete animals (outlined in orange), while a fluorescence channel (colored overlays in right panels) was used to detect different types of fluorescently tagged transgenes in correctly identified objects. (K–N) Fluorescence images of well-fed (K) and starved (M) animals expressing the autophagy marker, mCherry::LGG-1. In well-fed animals, mCherry::LGG-1 was diffusely cytoplasmic (K). In contrast, induction of autophagy by starvation leads to a punctate fluorescence pattern within intestinal cells, as LGG-1 is incorporated in to autophagosomes (M). (L, N) Higher magnification of the boxed areas in (K) and (M), respectively. (O–Q) The different types of transgene expression were quantified by spot count (O), spot area (P) or spot intensity (Q) per animal. Spot count, spot area and spot intensity values for each of the transgenic lines were significantly (Student's t-test, P<0.001) different to that of N2 animals. Data derived from 10–50 wells containing ∼20 animals/well. Scale bars, 225 µm (A–J, K, M), 50 µm (L, N).
Figure 3
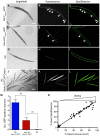
Figure 3. Identification of live cells or dead animals using C. elegans.
The ArrayScan VTI and SpotDetector BioApplication was used to discriminate between wild-type and toxic gain-of-function mec-4(d) mutants based on the survival of the 6 mechanosensory neurons in C. elegans. Brightfield (left), fluorescence (center) and SpotDetector rendered (right) images are depicted for each line. (A–C, M) In N2 (wild-type) animals, Pmec-4GFP expression was evident within 5.7±0.7 touch-sensing neurons (arrowheads). (D–F, M) In the mec-4(d) mutant background, the number of Pmec-4GFP expressing neurons (arrowheads) was significantly reduced and averaged 2.0±0.7 neurons per animal. (G–I, M) No GFP-positive neurons were identified in non-transgenic, N2 worms. Data derived from minimum of 32 wells containing ∼20 animals/well. Statistical significance determined using the Student's t-test, **P<0.001. The system was then used to discriminate live from dead animals. (J–L) Adult worms expressing the pharyngeal marker, Pmyo-2mRFP, were incubated with various concentrations of NaN3, stained with SYTOX® Green and imaged using the ArrayScan VTI (J–K). The SpotDetector BioApplication was optimized to determine the percentage of dead animals by counting the number of SYTOX® Green -positive bodies (L) and dividing by the total number of Pmyo-2mRFP-positive heads (not shown) detected in the GFP and TRITC fluorescence channels, respectively. (N) Percentage of dead animals at different NaN3 concentrations as determined by visual inspection versus that determined by SpotDetector. The slope and goodness-of-fit (r 2) of the linear regression were 1.0 and 0.95, respectively. The slope of the line was not significantly different to 1 indicating near 1∶1 correlation (P>0.95). Scale bars, 100 µm (A–I), 225 µm, (J–L).
Figure 4
Figure 4. Identification of animals in a mixed population using a fluorescent head- marker.
Thirty-six animals expressing the pharyngeal marker, Pmyo-2mRFP were sorted into wells of 384-well plate. The wells contained different percentages (0–100%) of L4/young, and the SpotDetector BioApplication was optimized to select this group and reject younger animals (L1, L2and L3 stages). (A) A brightfield-mRFP composite image of transgenic worms at different stages expressing Pmyo-2mRFP. (B) A SpotDetector image showing the ability to differentiate adults (magenta overlay) from earlier staged larvae (white overlay) based on a combination of fluorescent spot area and intensity in the pharyngeal region. (C) Correlation between the percent of adults actually sorted per well vs. the percent of adults as determined by SpotDetector. The slope and goodness-of-fit (r 2) of the linear regression were 0.92 and 1.0, respectively. The slope of the line was not significantly different to 1 indicating near 1∶1 correlation (P>0.05). Scale bar, 450 µm.
Figure 5
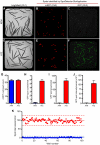
Figure 5. High-content analysis of transgenic animals expressing the wild-type (ATM) and mutant (ATZ) forms of human α1-antitrypsin (AT) fused to GFP.
Thirty-five young adult animals were sorted into wells of a 385-well plate and imaged using the ArrayScan VTI. (A, D) Brightfield images of sGFP::ATM and sGFP::ATZ expressing transgenic animals, respectively. (B, E) SpotDetector images of fluorescent red heads for corresponding transgenic lines pictured in (A) and (D), respectively. (C, F) SpotDetector images of sGFP::ATM and sGFP::ATZ expressing transgenic animals imaged in (B) and (E), respectively. (G) The average number of transgenic animals in each well was determined by counting the number of mRFP-positive heads in channel 2 (TRITC). (H–J) The amount of sGFP::ATZ (green intracellular inclusions) accumulating within the intestinal cells of transgenic animals was compared to that of the sGFP::ATM line using the SpotDetector BioApplication to analyze the signal detected in channel 3 (GFP). Animals expressing the mutant protein (ATZ) were distinguished clearly from those animals expressing the wild-type protein (ATM) whether comparing total spot count (H), area (I) or intensity (J) per animal. Number of animals analyzed 2,240 (ATM) and 2,240 (ATZ). Error bars represent SD. (K) Assay quality was assessed using a scatter plot comparing total GFP-spot area/well (n = 100 wells or 3,500 animals per strain) of sGFP::ATZ animals (red dots) to that of wild-type animals (blue dots). Solid and dotted lines indicate the mean spot area±3 standard deviations from the mean, respectively. The Z′-factor for this assay≈0.7.
Figure 6
Figure 6. LOPAC library screen.
(A) Total spot area per animal (object), (B) z-scores and (C) B-scores from a representative screen to measure the effects of 1280 LOPAC compounds on sGFP::ATZ accumulation in transgenic animals. The x-axis represents the molecular identification (Mol ID) number of the compound. Known autofluorescent compounds were excluded from the plot. Selected compounds, based on rank-order (Table 1) were analyzed for dose-dependent responses. Well images and dose-responses were obtained for compounds that decreased ((D) cantharidin, (E) fluphenazine and (F) pimozide) or increased ((G) tyrphostin AG 879) sGFP::ATZ accumulation. In each panel (D–G), well images on the left and right are DMSO (control)- and drug-treated animals, respectively. (H–K) Higher magnification fluorescent (top) and merged DIC (bottom) images of (H, J) DMSO- or (I, K) cantharidin- treated animals. Note loss of GFP::ATZ accumulation in the cantharidin treated animal. Scale bars, 450 µm (D–G) and 50 µm (H–K). Error bars represent SEM. Number of animals used was 140 for each compound concentration and 520 for the DMSO control. Significance was determined using an unpaired Student's t-test. Asterisks indicate values that differed significantly from animals treated with DMSO. *P<0.01 and **P<0.001.
Figure 7
Figure 7. Induction of autophagy by hit compounds.
Images of transgenic animals expressing Pnhx-2mCherry::lgg-1 treated with various compounds are shown. Images were acquired using a Nikon instruments TiEclipse widefield light microscope fitted with a 20× Plan Apochromat objective. Images were deconvolved using Volocity (Perkin Elmer, v 5.3.2). Deconvolved z planes were merged to a single plane. Well-fed animals treated with (A) DMSO show a diffuse mCherry expression throughout the intestine. In contrast, animals treated with (B) cantharidin, (C) fluphenazine and (D) pimozide show a markedly punctate distribution pattern indicative of increased autophagic activity. (E) Starved animals are included as a positive control for autophagy. Scale bar, 50 µm.

References

    1. Aguzzi A, O'Connor T. Protein aggregation diseases: pathogenicity and therapeutic perspectives. Nat Rev Drug Discov. 2010;9:237–248. - PubMed
    1. Herczenik E, Gebbink MF. Molecular and cellular aspects of protein misfolding and disease. FASEB J. 2008;22:2115–2133. - PubMed
    1. Krebs MP, Holden DC, Joshi P, Clark CL, 3rd, Lee AH, et al. Molecular mechanisms of rhodopsin retinitis pigmentosa and the efficacy of pharmacological rescue. J Mol Biol. 2010;395:1063–1078. - PubMed
    1. Lomas DA, Belorgey D, Mallya M, Miranda E, Kinghorn KJ, et al. Molecular mousetraps and the serpinopathies. Biochem Soc Trans. 2005;33:321–330. - PubMed
    1. Picken MM. Amyloidosis-where are we now and where are we heading? Arch Pathol Lab Med. 2010;134:545–551. - PubMed

Publication types

MeSH terms