. 2011 Feb;39(2):864-83.
doi: 10.1007/s10439-010-0202-4. Epub 2010 Nov 20.

Quantification of particle residence time in abdominal aortic aneurysms using magnetic resonance imaging and computational fluid dynamics

Affiliations

Quantification of particle residence time in abdominal aortic aneurysms using magnetic resonance imaging and computational fluid dynamics

Ga-Young Suh et al. Ann Biomed Eng. 2011 Feb.

Abstract

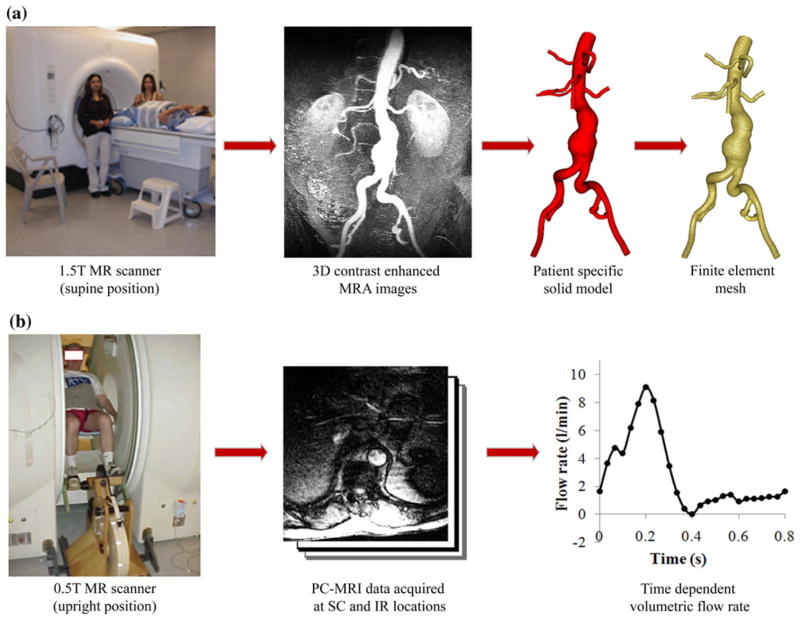
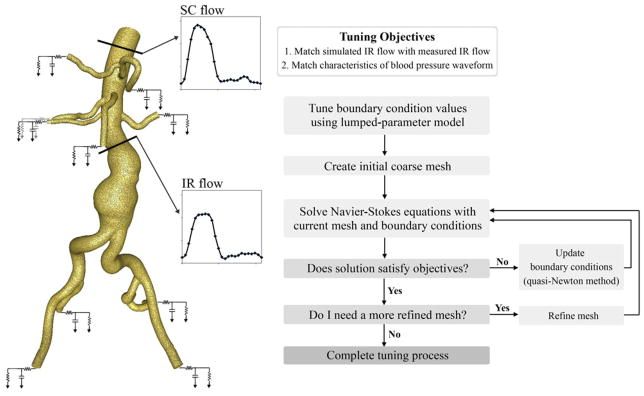
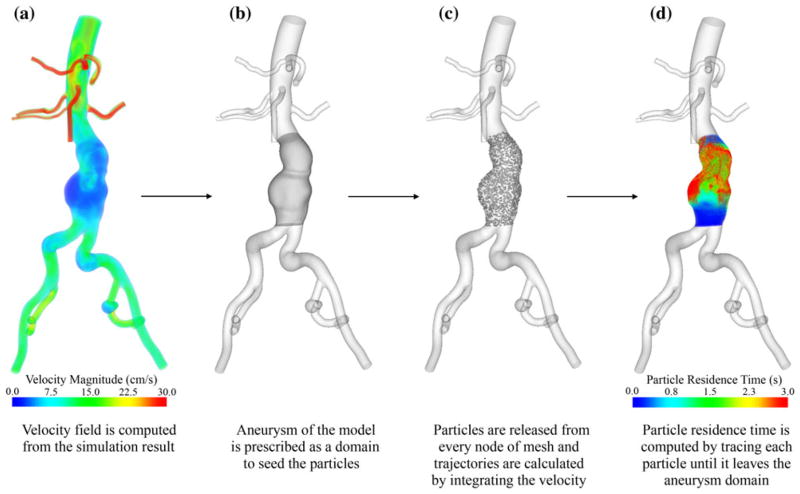
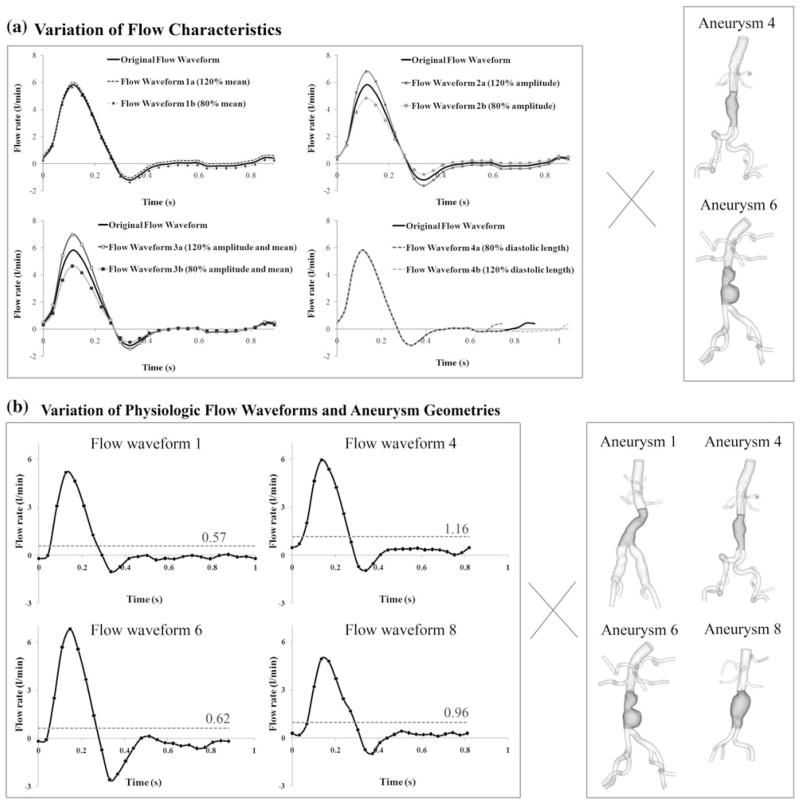
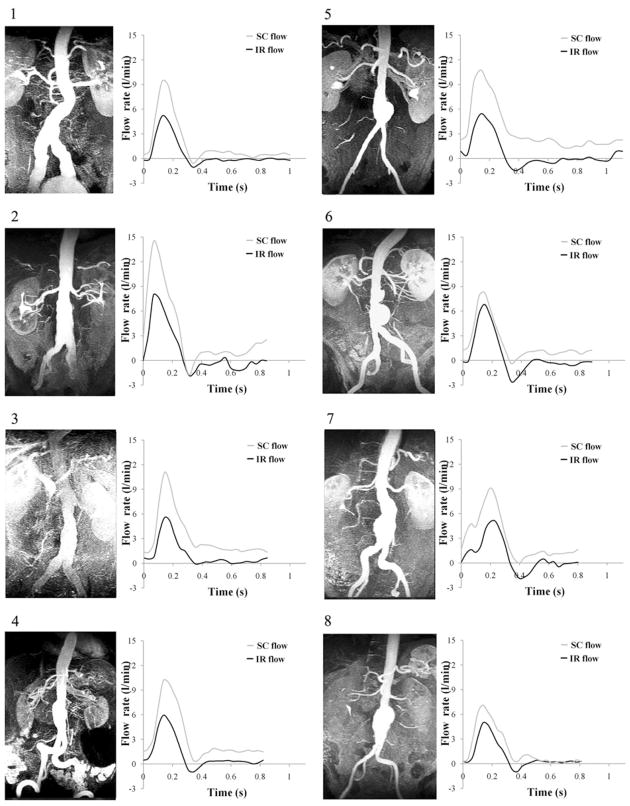
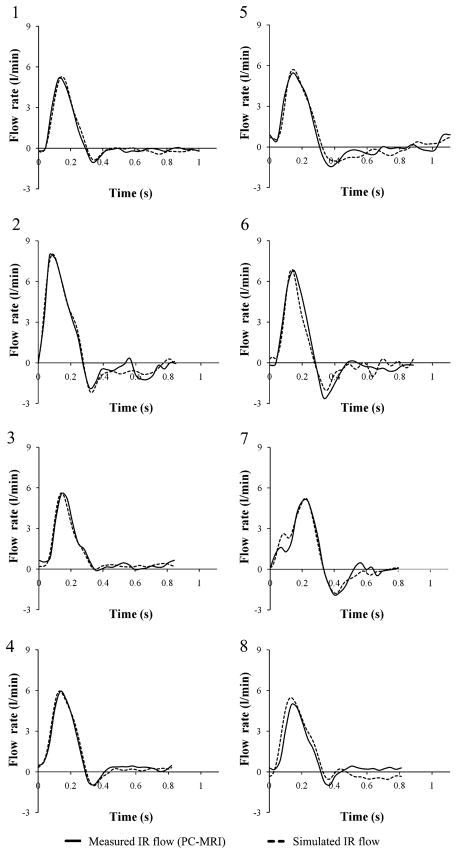
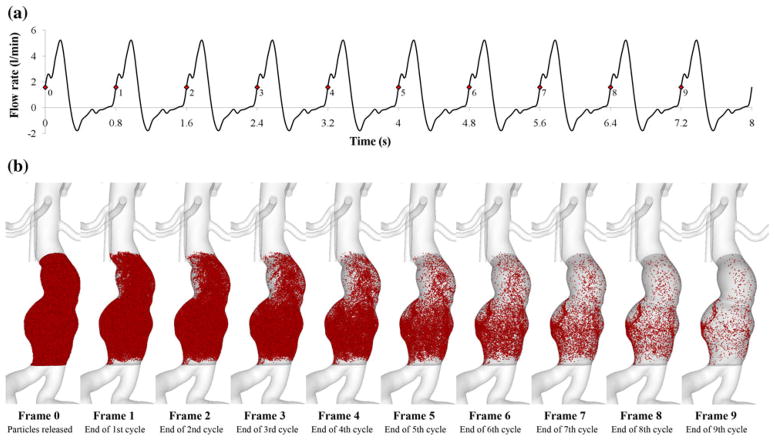
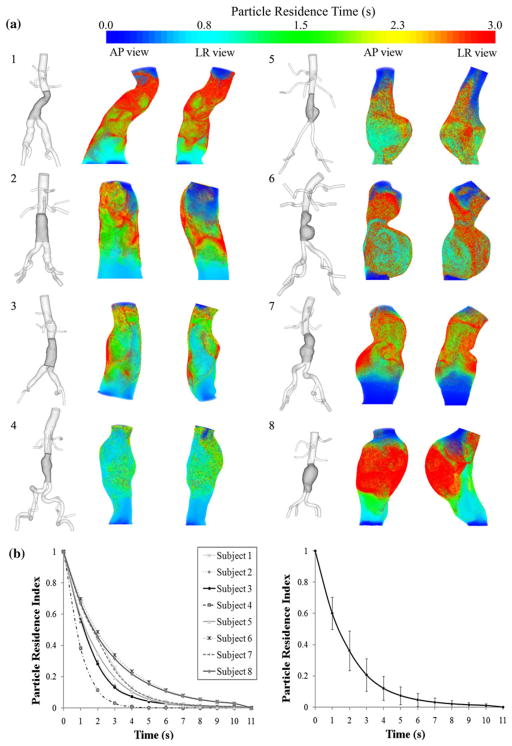
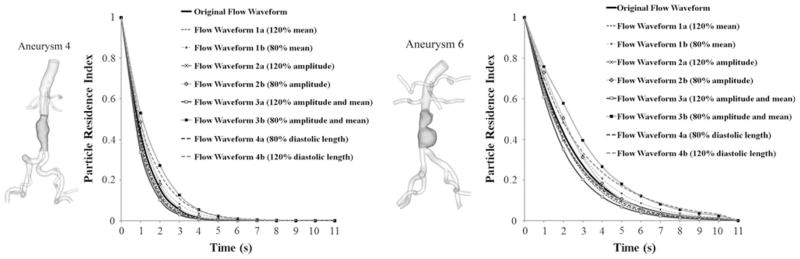
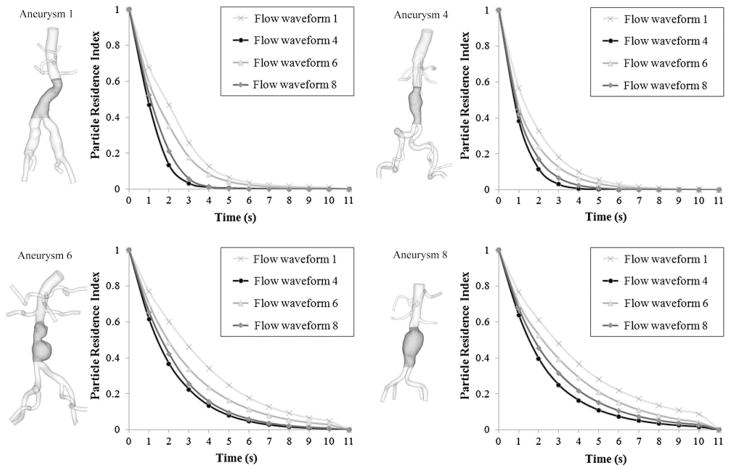
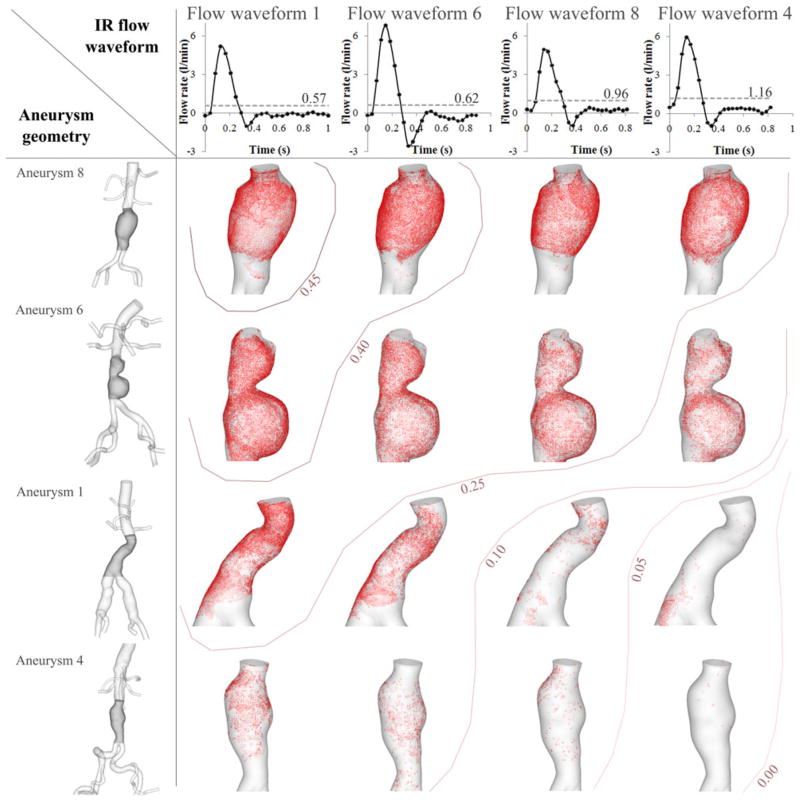
Hemodynamic conditions are hypothesized to affect the initiation, growth, and rupture of abdominal aortic aneurysms (AAAs), a vascular disease characterized by progressive wall degradation and enlargement of the abdominal aorta. This study aims to use magnetic resonance imaging (MRI) and computational fluid dynamics (CFD) to quantify flow stagnation and recirculation in eight AAAs by computing particle residence time (PRT). Specifically, we used gadolinium-enhanced MR angiography to obtain images of the vessel lumens, which were used to generate subject-specific models. We also used phase-contrast MRI to measure blood flow at supraceliac and infrarenal locations to prescribe physiologic boundary conditions. CFD was used to simulate pulsatile flow, and PRT, particle residence index, and particle half-life of PRT in the aneurysms were computed. We observed significant regional differences of PRT in the aneurysms with localized patterns that differed depending on aneurysm geometry and infrarenal flow. A bulbous aneurysm with the lowest mean infrarenal flow demonstrated the slowest particle clearance. In addition, improvements in particle clearance were observed with increase of mean infrarenal flow. We postulate that augmentation of mean infrarenal flow during exercise may reduce chronic flow stasis that may influence mural thrombus burden, degradation of the vessel wall, and aneurysm growth.


Figures

FIGURE 1
FIGURE 1
Data acquisition using magnetic resonance imaging (MRI). (a) AAA subjects were scanned in the supine position using a 1.5 T Signa MR scanner (GE Medical Systems, Milwaukee WI) to image the lumen of the abdominal aorta using a 3D gadolinium-enhanced magnetic resonance angiography (MRA) sequence. These images were processed using custom software to generate a 3D solid model and a finite element mesh (MeshSim, Simmetrix, Clifton Park, NY). (b) Next, each subject was scanned in the upright position using a 0.5 T Signa MR scanner (GE Medical Systems, Milwaukee WI) and acquired cine phasecontrast MRI (PC-MRI) data at supraceliac (SC) and infrarenal (IR) locations. PC-MRI data were collected under resting conditions and during lower limb exercise conditions on a custom MR-compatible cycle. We used the PC-MRI images acquired during resting conditions herein, and extracted the time-dependent volumetric flow rate at each location with 24 time points over the cardiac cycle.
FIGURE 2
FIGURE 2
Boundary conditions and automated tuning algorithm: for the simulation, supraceliac (SC) flow was prescribed as an inlet boundary condition; Rp, C, Rd (RCR) parameter values consisting of a proximal resistance (Rp), representing the resistance of the proximal arteries, capacitance (C), representing the compliance of the proximal arteries, and distal resistance (Rd), representing the resistance of the distal vessels were prescribed at each outlet,; characteristics of the infrarenal (IR) flow and blood pressure waveforms were used as objectives to tune the RCR parameter values of outlets. Automated tuning processes included tuning a lumped-parameter model, performing an initial simulation using a coarse mesh, updating the current RCR parameter values, running additional simulations until the solution satisfied the tuning objectives, and performing the final simulation with a refined mesh.
FIGURE 3
FIGURE 3
The process of computation of particle residence time (PRT). (a) The background velocity field was computed using the final pulsatile simulation data. (b) The aneurysm domain was prescribed to seed the particles. (c) Particles were seeded and released at each node of the mesh, each particle was monitored for 12 s, and trajectories were computed. (d) PRT, the transit time for a particle released from a given position to exit the prescribed domain, was computed for each particle. The contour plot was colored based on the seeded positions of the particles with PRT ranging from 0 to 3 s. PRT greater than 3 s appeared as red.
FIGURE 4
FIGURE 4
(a) Input sensitivity analysis with variation of flow characteristics. An original flow waveform was generated by averaging the Infrarenal (IR) flow waveforms of eight subjects. The arithmetic mean, amplitude, and diastolic length were varied from the original flow waveform by 20%. Aneurysm geometries of subjects 4 and 6, named as aneurysms 4 and 6, were included in this analysis. (b) Input sensitivity analysis with variation of four physiologic flow waveforms and four aneurysm geometries. IR flow waveforms of subjects 1, 4, 6, and 8 during one cardiac cycle, named as flow waveform 1, 4, 6, and 8 were paired with aneurysm geometries of subjects 1, 4, 6, and 8, named as aneurysms 1, 4, 6, and 8. In total, 16 cases were tested in this analysis. The mean values of four IR flow waveforms were visualized by a dashed line with its value on each plot.
FIGURE 5
FIGURE 5
The maximum intensity projection (MIP) images acquired from magnetic resonance angiography (MRA) scan (left column of each pair), and supraceliac (SC) and infrarenal (IR) flow waveform during a single cardiac cycle (right column of each pair) from phase-contrast MRI data.
FIGURE 6
FIGURE 6
Measured infrarenal (IR) flow waveform from phase-contrast magnetic resonance imaging (PC-MRI) data, and simulated IR flow waveform during a single cardiac cycle for all eight subjects.
FIGURE 7
FIGURE 7
(a) Infrarenal (IR) flow waveform of subject 7 during 10 cardiac cycles. To compute particle residence time (PRT), we repeated IR flow waveform assuming that blood flow is periodic. We released particles at frame 0 (the first red spot marked as 0 on the plot) in early systole of the first cardiac cycle, and monitored the particles at frame 1, 2,…, 9 in the subsequent early systoles of nine cardiac cycles. (b) Particle tracing over successive cardiac cycles. Particles were visualized until they left the aneurysm domain. Note that at the end of the 9th cycle (frame 9), most of the particles left the domain except the particles in the posterior portion of the left lower lobe.
FIGURE 8
FIGURE 8
(a) 3D models of all eight subjects (left of each pair) and contour plots of particle residence time (PRT) in anteriorto- posterior (AP) and left-to-right (LR) views (right of each pair). The aneurysm domain for PRT computation was highlighted with a dark gray color on the 3D model. The contour plots of PRT were colorized based on the seeded positions of the particles. For visualization of all subjects, we chose PRT with particles released in early diastole. (b) Particle residence index (PRI) versus time of eight subjects (left), and averaged PRI with standard deviation (right). PRI were calculated at each second by dividing the number of residing particles by the total number of released particles.
FIGURE 9
FIGURE 9
3D model of subjects 4 and 6 with the aneurysm domain highlighted with dark gray color, named as aneurysms 4 and 6 (left of each pair), and particle residence index (PRI) versus time prescribing artificially generated original flow waveform and variation of mean only (flow waveforms 1a and 1b), amplitude only (flow waveforms 2a and 2b), combination of amplitude and mean variation (flow waveforms 3a and 3b), and combination of diastolic length and mean variation (flow waveforms 4a and 4b) by 20% of their original values (right of each pair).
FIGURE 10
FIGURE 10
3D model of subjects 1, 4, 6, and 8 with the aneurysm domain highlighted with dark gray color, named as aneurysms 1, 4, 6, and 8 (left of each pair), and particle residence index (PRI) versus time prescribing four different physiologic IR flow waveforms to each of four aneurysm geometries (right of each pair). Note that for all aneurysm geometries, the case prescribing flow waveform 1 showed the slowest particle clearance (light gray curve with 3 marker). Also, we observed a more rapid decline in PRI curves for the cases with fusiform aneurysm geometry (aneurysms 1 and 4) compared to the cases with bulbous aneurysm geometry (aneurysms 6 and 8).
FIGURE 11
FIGURE 11
Particle residence time (PRT) map with variation of aneurysm geometry and infrarenal (IR) flow waveform. The horizontal axis shows the different IR flow waveforms of four subjects, and the vertical axis shows the aneurysm geometry of four subjects. We tested 16 cases in total to examine the difference in PRT when aneurysm geometry and IR flow waveform were varied. The order of IR flow waveforms on the horizontal axis was determined by mean IR flow (left with the lowest mean IR flow to right with the highest mean IR flow). Mean IR flow for each case was visualized by a dashed line with its value on each plot on the horizontal axis. The order of aneurysms on the vertical axis was determined by relative volume of aneurysm (top with the biggest aneurysm to bottom with the smallest aneurysm). We visualized the long PRT regions by marking the initial positions of the particles with PRT longer than 3 s as red points for each case. Contour lines with numerics represent the range of particle residence index (PRI) at 3 s. The case with the aneurysm 8 and flow waveform 1 showed the highest PRI, and the case with aneurysm 4 and flow waveform 4 showed the lowest PRI. For visualization of a long PRT region, we chose the data set with particles released in early diastole.

References

    1. Bluestein D, Niu L, Schoephoerster RT, Dewanjee MK. Steady flow in an aneurysm model: correlation between fluid dynamics and blood platelet deposition. J Biomech Eng. 1996;118:280–286. - PubMed
    1. Bluestein D, Niu L, Schoephoerster RT, Dewanjee MK. Fluid mechanics of arterial stenosis: relationship to the development of mural thrombus. Ann Biomed Eng. 1997;25(2):344–356. - PubMed
    1. Butty VD, Gudjonsson K, Buchel P, Makhijani VB, Ventikos Y, Poulikakos D. Residence times and basins of attraction for a realistic right internal carotid artery with two aneurysms. Biorheology. 2002;29:387–393. - PubMed
    1. Cao J, Rittgers SE. Particle motion within in vitro models of stenosed internal carotid and left anterior descending coronary arteries. Ann Biomed Eng. 1998;26:190– 199. - PubMed
    1. Cheng CP, Herfkens RJ, Taylor CA. Abdominal aortic hemodynamic conditions in healthy subjects aged 50–70 at rest and during lower limb exercise: in vivo quantification using MRI. Atherosclerosis. 2003;168:323–331. - PubMed

Publication types