

Altered MEF2 isoforms in myotonic dystrophy and other neuromuscular disorders
- PMID: 21104860
- PMCID: PMC4136472
- DOI: 10.1002/mus.21789
Altered MEF2 isoforms in myotonic dystrophy and other neuromuscular disorders
Abstract
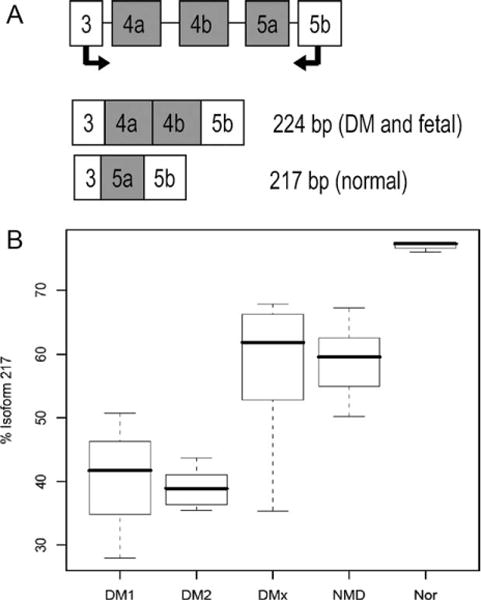
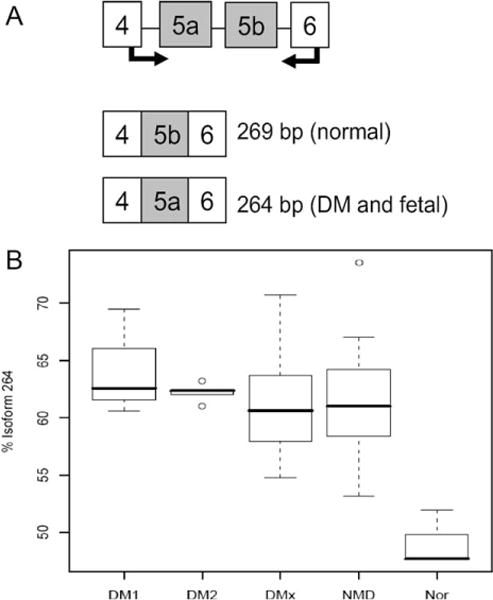
Because of their central role in muscle development and maintenance, MEF2 family members represent excellent candidate effectors of the muscle pathology in myotonic dystrophy (DM). We investigated the expression and alternative splicing of all four MEF2 genes in muscle from neuromuscular disorder (NMD) patients, including DM1 and DM2. We observed MEF2A and MEF2C overexpression in all NMD muscle, including 12 MEF2-interacting genes. Exon 4 and 5 usage in MEF2A and MEF2C was different between DM and normal muscle, with DM showing the embryonic isoform. Similar splicing differences were observed in other NMD muscle. For MEF2C, missplicing was more pronounced in DM than in other dystrophies. Our data confirm dysregulation of MEF2A and MEF2C expression and splicing in several NMD, including DM. Our findings demonstrate that aberrant splicing in NMD is independent from expression of mutant repeats, and suggests that some aberrant splicing, even in DM, may be compensatory rather than primary.
Figures
Similar articles
-
Most expression and splicing changes in myotonic dystrophy type 1 and type 2 skeletal muscle are shared with other muscular dystrophies.Neuromuscul Disord. 2014 Mar;24(3):227-40. doi: 10.1016/j.nmd.2013.11.001. Epub 2013 Nov 15. Neuromuscul Disord. 2014. PMID: 24332166 Free PMC article.
-
Phosphorylation and alternative pre-mRNA splicing converge to regulate myocyte enhancer factor 2C activity.Mol Cell Biol. 2004 Sep;24(18):8264-75. doi: 10.1128/MCB.24.18.8264-8275.2004. Mol Cell Biol. 2004. PMID: 15340086 Free PMC article.
-
Alternative splicing of human insulin receptor gene (INSR) in type I and type II skeletal muscle fibers of patients with myotonic dystrophy type 1 and type 2.Mol Cell Biochem. 2013 Aug;380(1-2):259-65. doi: 10.1007/s11010-013-1681-z. Epub 2013 May 11. Mol Cell Biochem. 2013. PMID: 23666741
-
Molecular mechanisms of muscle atrophy in myotonic dystrophies.Int J Biochem Cell Biol. 2013 Oct;45(10):2280-7. doi: 10.1016/j.biocel.2013.06.010. Epub 2013 Jun 21. Int J Biochem Cell Biol. 2013. PMID: 23796888 Free PMC article. Review.
-
Skeletal muscle mass is controlled by the MRF4-MEF2 axis.Curr Opin Clin Nutr Metab Care. 2018 May;21(3):164-167. doi: 10.1097/MCO.0000000000000456. Curr Opin Clin Nutr Metab Care. 2018. PMID: 29389722 Review.
Cited by
-
A Candidate RNAi Screen Reveals Diverse RNA-Binding Protein Phenotypes in Drosophila Flight Muscle.Cells. 2021 Sep 22;10(10):2505. doi: 10.3390/cells10102505. Cells. 2021. PMID: 34685485 Free PMC article.
-
Skeletal muscle-specific overexpression of miR-486 limits mammary tumor-induced skeletal muscle functional limitations.Mol Ther Nucleic Acids. 2022 Mar 16;28:231-248. doi: 10.1016/j.omtn.2022.03.009. eCollection 2022 Jun 14. Mol Ther Nucleic Acids. 2022. PMID: 35402076 Free PMC article.
-
GCN5 maintains muscle integrity by acetylating YY1 to promote dystrophin expression.J Cell Biol. 2022 Feb 7;221(2):e202104022. doi: 10.1083/jcb.202104022. Epub 2022 Jan 13. J Cell Biol. 2022. PMID: 35024765 Free PMC article.
-
MASTR directs MyoD-dependent satellite cell differentiation during skeletal muscle regeneration.Genes Dev. 2012 Jan 15;26(2):190-202. doi: 10.1101/gad.179663.111. Genes Dev. 2012. PMID: 22279050 Free PMC article.
-
Role of CD14 in human disease.Immunology. 2023 Jul;169(3):260-270. doi: 10.1111/imm.13634. Epub 2023 Mar 27. Immunology. 2023. PMID: 36840585 Free PMC article. Review.
References
-
- Olson EN, Perry M, Schulz RA. Regulation of muscle differentiation by the MEF2 family of MADS box transcription factors. Dev Biol. 1995;172:2–14. - PubMed
-
- McKinsey TA, Zhang CL, Olson EN. MEF2: a calcium-dependent regulator of cell division, differentiation and death. Trends Biochem Sci. 2002;27:40–47. - PubMed
-
- Potthoff MJ, Olson EN. MEF2: a central regulator of diverse developmental programs. Development. 2007;134:4131–4140. - PubMed
-
- Black BL, Olson EN. Transcriptional control of muscle development by myocyte enhancer factor-2 (MEF2) proteins. Annu Rev Cell Dev Biol. 1998;14:167–196. - PubMed
Publication types
MeSH terms
Substances
Grants and funding
LinkOut - more resources
Full Text Sources
Medical
Molecular Biology Databases
