

doi: 10.1002/anie.201005402.
Single-molecule four-color FRET
Affiliations
- PMID: 21104966
- PMCID: PMC3733783
- DOI: 10.1002/anie.201005402
Item in Clipboard
Single-molecule four-color FRET
Angew Chem Int Ed Engl.
.
Abstract
We developed a single-molecule four-color FRET technique both in confocal and in total-internal-reflection fluorescence microscopies. Real-time determination of six inter-fluorophore FRET efficiencies allowed us to probe the correlated motion of four arms of the Holliday junction. The technique was also applied to assess the correlation of RecA-mediated strand exchange events at both ends of a synaptic complex.
Figures
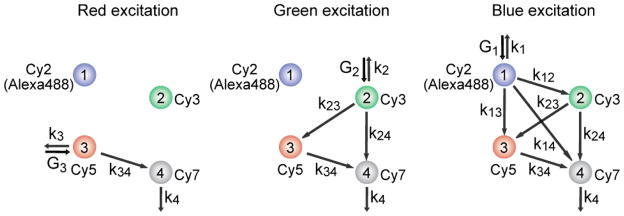
Interaction diagram of four fluorophores, and the alternating laser excitation scheme to determine six inter-dye FRET efficiencies.
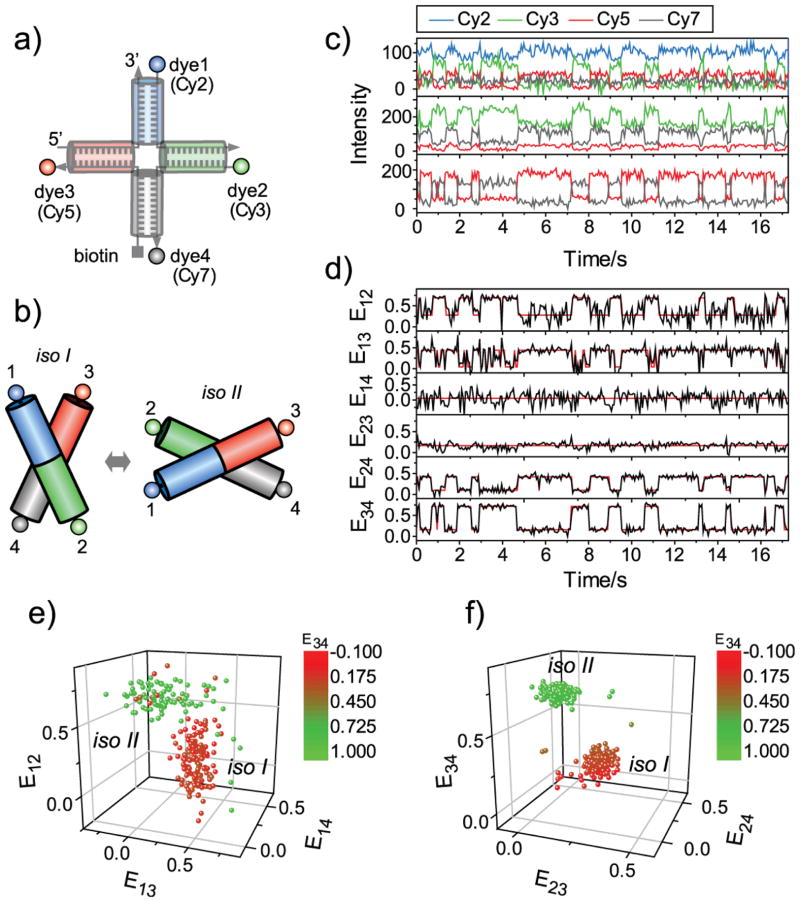
Holliday junction dynamics observed via single molecule four-color FRET. a) Labelling scheme. b) A conformational dynamics model of the Holliday junction. c) Representative fluorescence intensity time traces at blue (top), green (middle), and red excitations (bottom). Fluorescence signals of Cy2, Cy3, Cy5 and Cy7 are colored in blue, green, red and gray, respectively. In the top panel, Cy2 signal is vertically shifted for clear visualization. d) FRET efficiency time traces. The six FRET efficiencies (black lines) were calculated from the data in c) following the method described in Supporting Information. Red lines are the most probable FRET trajectories generated by Hidden Markov Modeling. e) Three-dimensional distribution of E12, E13, and E14 of d). f) Three-dimensional distribution of E34, E23, and E24 of d). To make a connection between e) and f), each data point in the plots is color-coded based on E34.
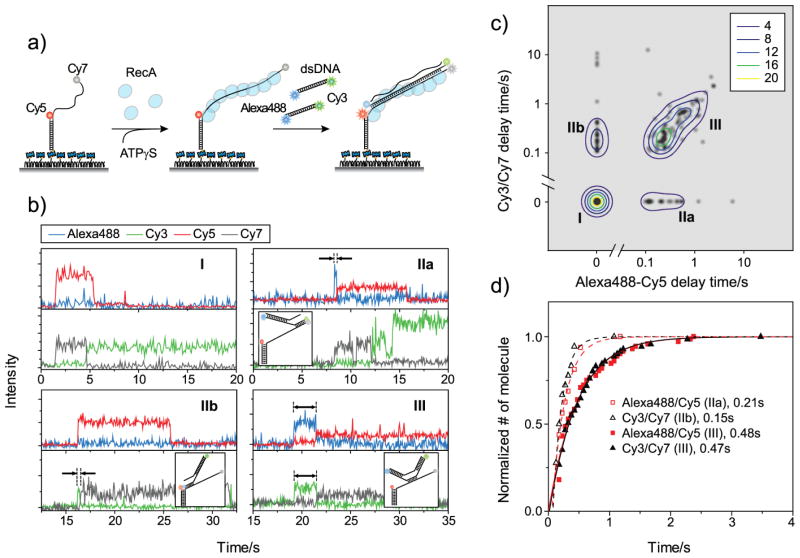
RecA-mediated strand exchange experiments. a) A schematic diagram of the experiments. b) Representative fluorescence intensity time traces of strand exchange. In each plot, the top panel shows the intensity trace of Alexa488 (blue lines), and that of Cy5 (red lines) at 473-nm excitation and the bottom panel shows Cy3 (green lines), and Cy7 (gray lines) signals at 532-nm excitation. Delay times and corresponding models of strand exchange initiation are shown in the figure. c) Relative distribution of delay times at both ends of the synaptic complex from 135 molecules. To visualize the distribution of delay times, each data point is represented as a gray-scaled 2-D Gaussian distribution. A contour plot of population density was overlaid for clear visualization of the three species. d) Cumulative probability distributions of the delay times of each species. By fitting the distributions to single exponential functions, delay times required for the completion of strand exchange were obtained.
References
Publication types
MeSH terms
Substances
Grants and funding
LinkOut - more resources
Full Text Sources
Other Literature Sources
