

Rapid detection of pandemic influenza in the presence of seasonal influenza
- PMID: 21106071
- PMCID: PMC3001734
- DOI: 10.1186/1471-2458-10-726
Rapid detection of pandemic influenza in the presence of seasonal influenza
Abstract
Background: Key to the control of pandemic influenza are surveillance systems that raise alarms rapidly and sensitively. In addition, they must minimise false alarms during a normal influenza season. We develop a method that uses historical syndromic influenza data from the existing surveillance system 'SERVIS' (Scottish Enhanced Respiratory Virus Infection Surveillance) for influenza-like illness (ILI) in Scotland.
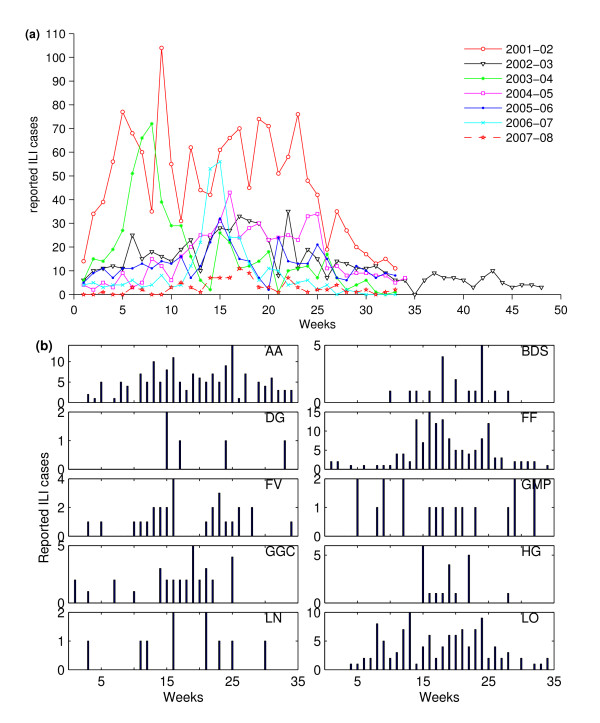
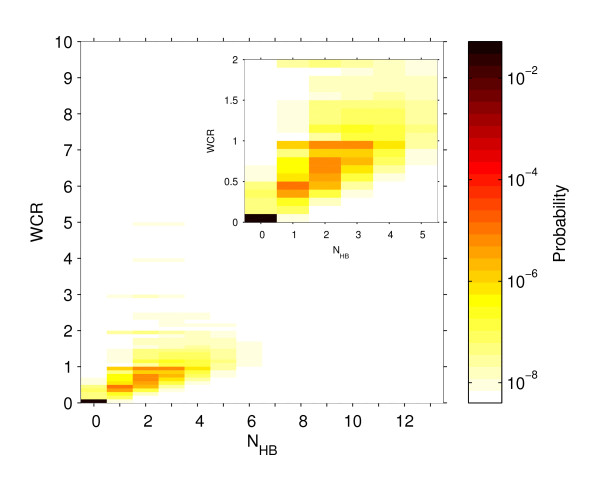
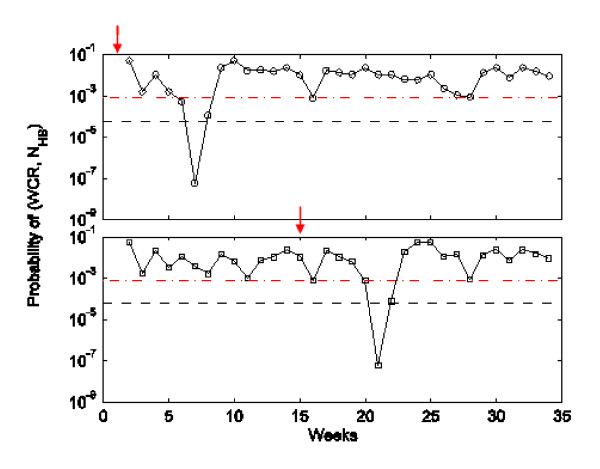
Methods: We develop an algorithm based on the weekly case ratio (WCR) of reported ILI cases to generate an alarm for pandemic influenza. From the seasonal influenza data from 13 Scottish health boards, we estimate the joint probability distribution of the country-level WCR and the number of health boards showing synchronous increases in reported influenza cases over the previous week. Pandemic cases are sampled with various case reporting rates from simulated pandemic influenza infections and overlaid with seasonal SERVIS data from 2001 to 2007. Using this combined time series we test our method for speed of detection, sensitivity and specificity. Also, the 2008-09 SERVIS ILI cases are used for testing detection performances of the three methods with a real pandemic data.
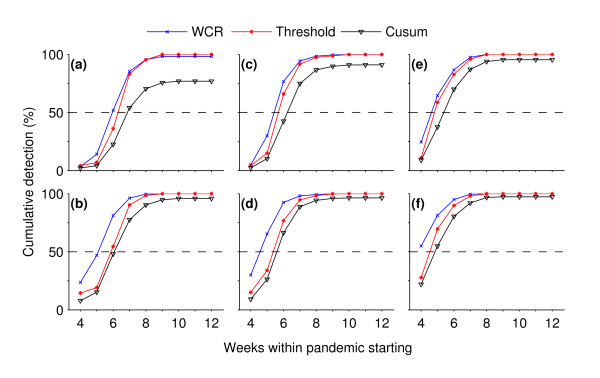
Results: We compare our method, based on our simulation study, to the moving-average Cumulative Sums (Mov-Avg Cusum) and ILI rate threshold methods and find it to be more sensitive and rapid. For 1% case reporting and detection specificity of 95%, our method is 100% sensitive and has median detection time (MDT) of 4 weeks while the Mov-Avg Cusum and ILI rate threshold methods are, respectively, 97% and 100% sensitive with MDT of 5 weeks. At 99% specificity, our method remains 100% sensitive with MDT of 5 weeks. Although the threshold method maintains its sensitivity of 100% with MDT of 5 weeks, sensitivity of Mov-Avg Cusum declines to 92% with increased MDT of 6 weeks. For a two-fold decrease in the case reporting rate (0.5%) and 99% specificity, the WCR and threshold methods, respectively, have MDT of 5 and 6 weeks with both having sensitivity close to 100% while the Mov-Avg Cusum method can only manage sensitivity of 77% with MDT of 6 weeks. However, the WCR and Mov-Avg Cusum methods outperform the ILI threshold method by 1 week in retrospective detection of the 2009 pandemic in Scotland.
Conclusions: While computationally and statistically simple to implement, the WCR algorithm is capable of raising alarms, rapidly and sensitively, for influenza pandemics against a background of seasonal influenza. Although the algorithm was developed using the SERVIS data, it has the capacity to be used at other geographic scales and for different disease systems where buying some early extra time is critical.
Figures


Similar articles
-
Attempted early detection of influenza A (H1N1) pandemic with surveillance data of influenza-like illness and unexplained pneumonia.Influenza Other Respir Viruses. 2011 Nov;5(6):e479-86. doi: 10.1111/j.1750-2659.2011.00248.x. Epub 2011 Apr 18. Influenza Other Respir Viruses. 2011. PMID: 21668678 Free PMC article.
-
Absence of influenza A(H1N1) during seasonal and pandemic seasons in a sentinel nursing home surveillance network in the Netherlands.J Am Geriatr Soc. 2011 Dec;59(12):2301-5. doi: 10.1111/j.1532-5415.2011.03715.x. Epub 2011 Oct 31. J Am Geriatr Soc. 2011. PMID: 22091963
-
Decreased Seasonal Influenza Rates Detected in a Crowdsourced Influenza-Like Illness Surveillance System During the COVID-19 Pandemic: Prospective Cohort Study.JMIR Public Health Surveill. 2023 Dec 28;9:e40216. doi: 10.2196/40216. JMIR Public Health Surveill. 2023. PMID: 38153782 Free PMC article.
-
Epidemiologic and virologic assessment of the 2009 influenza A (H1N1) pandemic on selected temperate countries in the Southern Hemisphere: Argentina, Australia, Chile, New Zealand and South Africa.Influenza Other Respir Viruses. 2011 Nov;5(6):e487-98. doi: 10.1111/j.1750-2659.2011.00249.x. Epub 2011 Apr 20. Influenza Other Respir Viruses. 2011. PMID: 21668677 Free PMC article. Review.
-
Harmonizing influenza primary-care surveillance in the United Kingdom: piloting two methods to assess the timing and intensity of the seasonal epidemic across several general practice-based surveillance schemes.Epidemiol Infect. 2015 Jan;143(1):1-12. doi: 10.1017/S0950268814001757. Epub 2014 Jul 15. Epidemiol Infect. 2015. PMID: 25023603 Free PMC article. Review.
Cited by
-
Using an innovative method to develop the threshold of seasonal influenza epidemic in China.PLoS One. 2018 Aug 31;13(8):e0202880. doi: 10.1371/journal.pone.0202880. eCollection 2018. PLoS One. 2018. PMID: 30169543 Free PMC article.
-
The Role of Serotype Interactions and Seasonality in Dengue Model Selection and Control: Insights from a Pattern Matching Approach.PLoS Negl Trop Dis. 2016 May 9;10(5):e0004680. doi: 10.1371/journal.pntd.0004680. eCollection 2016 May. PLoS Negl Trop Dis. 2016. PMID: 27159023 Free PMC article.
-
[Climate-sensitive diseases in Brazil and the world: systematic reviewEnfermedades sensibles al clima en Brasil y el mundo: revisión sistemática].Rev Panam Salud Publica. 2018 Jul 20;42:e85. doi: 10.26633/RPSP.2018.85. eCollection 2018. Rev Panam Salud Publica. 2018. PMID: 31093113 Free PMC article. Review. Portuguese.
-
Influenza detection and prediction algorithms: comparative accuracy trial in Östergötland county, Sweden, 2008-2012.Epidemiol Infect. 2017 Jul;145(10):2166-2175. doi: 10.1017/S0950268817001005. Epub 2017 May 17. Epidemiol Infect. 2017. PMID: 28511741 Free PMC article.
-
ICARES: a real-time automated detection tool for clusters of infectious diseases in the Netherlands.BMC Infect Dis. 2017 Mar 9;17(1):201. doi: 10.1186/s12879-017-2300-5. BMC Infect Dis. 2017. PMID: 28279150 Free PMC article.
References
-
- Lawson A, Kleinman K. Spatial and syndromatic surveillance for public health. Chichester: Wiley; 2005.
-
- Lombardo JS, Buckeridge DL. Disease surveillance: a public health informatics approach. Chichester: John Wiley; 2007.
-
- WHO. Avian influenza: assessing the pandemic threat. World Health Organization; 2005.
Publication types
MeSH terms
LinkOut - more resources
Full Text Sources
Medical
